Key Trading Levels - AUD/JPY, AUD/USD, EUR/JPY, EUR/USD, GBP/JPY, and GBP/USD

Overview
Duncan Cooper summarises the key trading levels of AU/DJPY, AUD/USD, EUR/JPY, EUR/USD, GBP/JPY, and GBP/USD for the week ahead.
Last week AUD/JPY, AUD/USD, EUR/JPY, EUR/USD, GBP/JPY, and GBP/USD all finished down for the week. EUR/USD almost traded down to the 1.0340 major monthly support level.
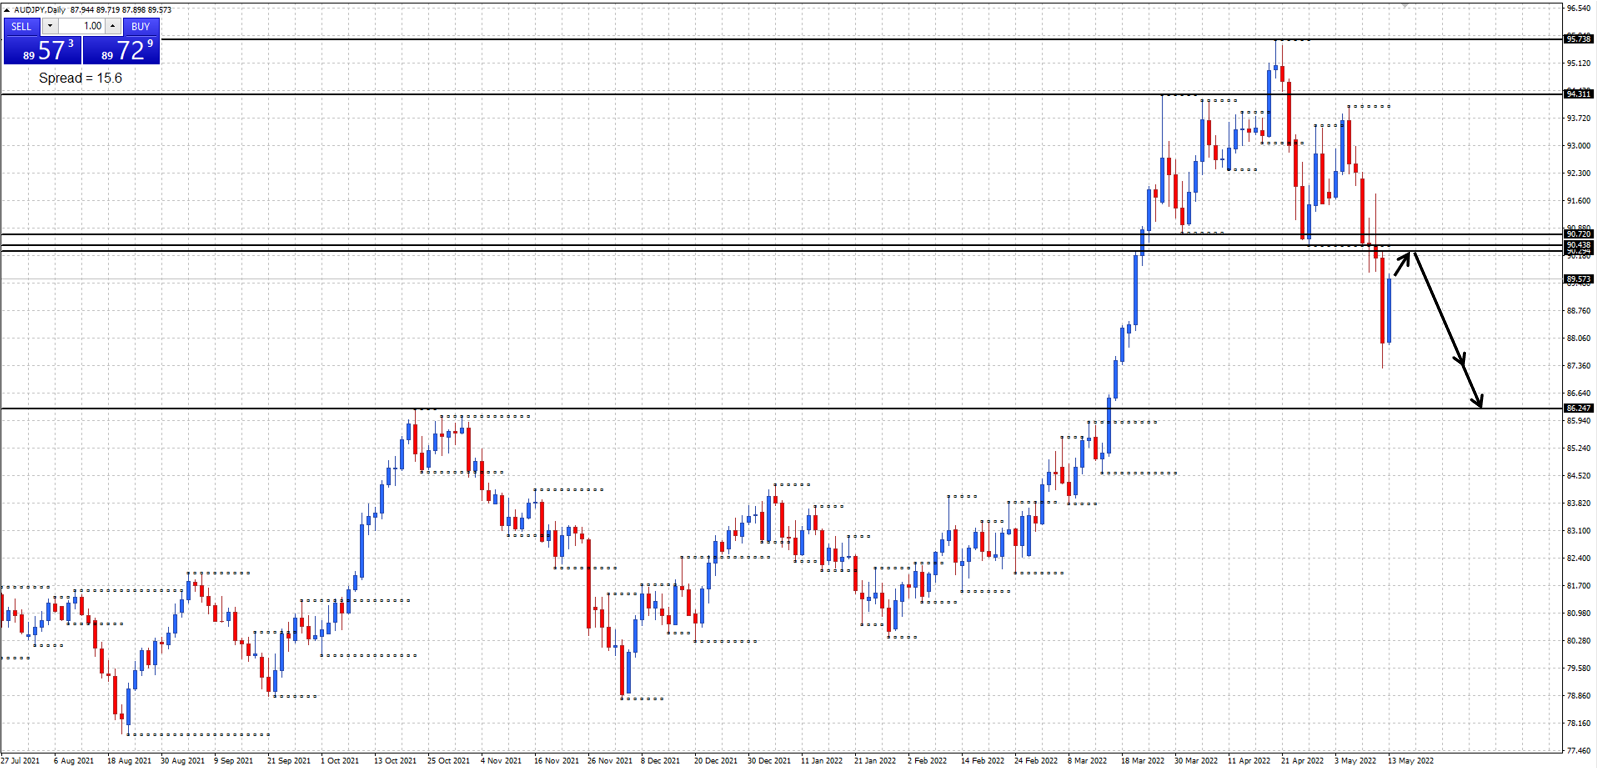
AUD/JPY Daily chart
Monthly support at 86.24, resistance at 90.29 and 90.72.
Weekly support at 86.24, resistance at 94.31 and 95.73.
Daily support at 86.24, resistance at 90.43.
Price declined below the 90.72 and 90.29 monthly support levels last week. Will price decline down to the 86.24 monthly support level this week?
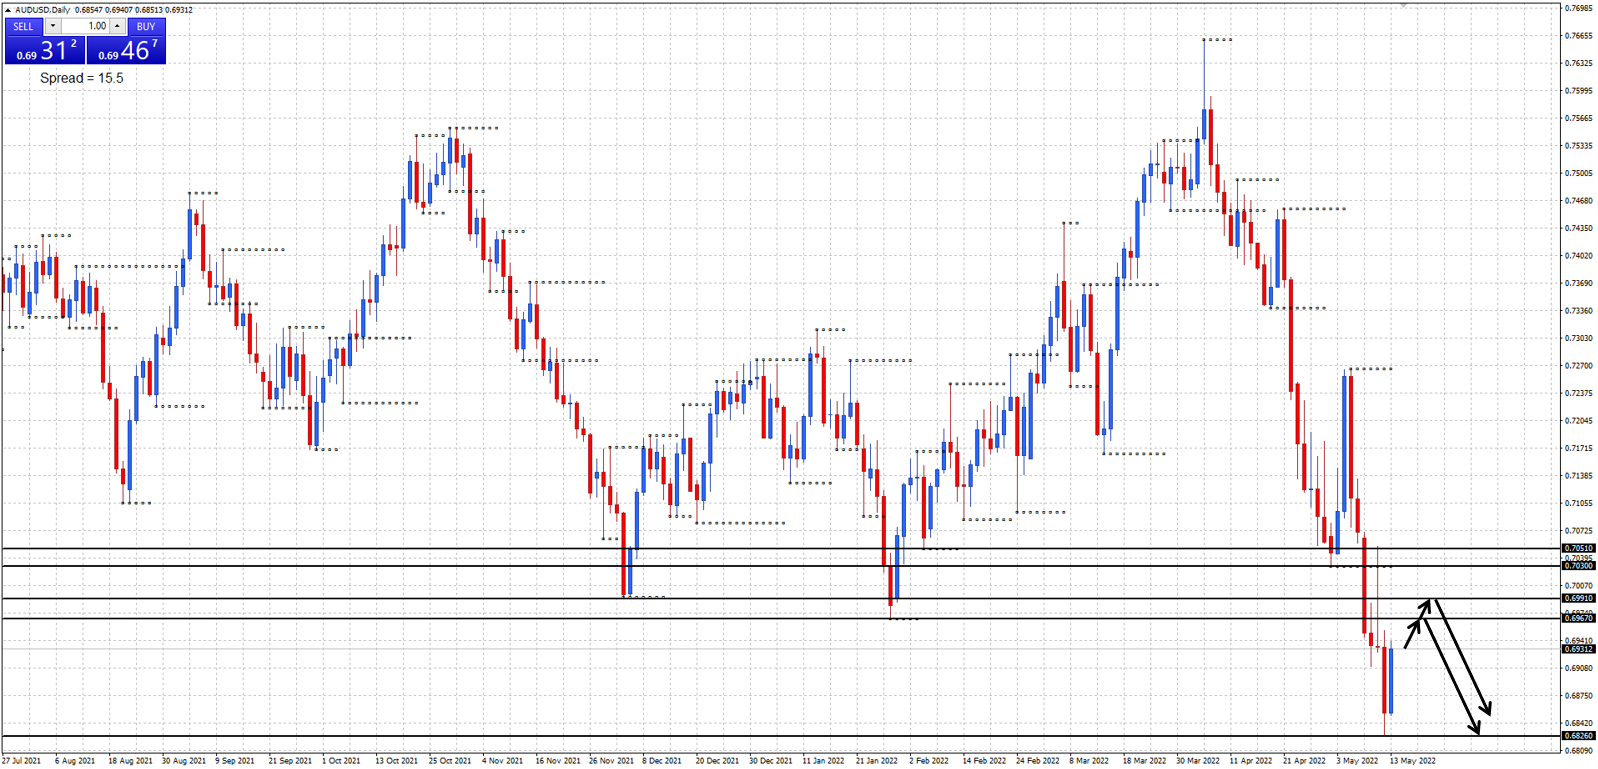
AUD/USD daily chart
Monthly support at 0.6826, resistance at 0.6967 and 0.6991.
Weekly support at 0.6826, resistance at 0.6967.
Daily support at 0.6826, resistance at 0.7030 and 0.7051.
Price declined and tested the 0.6826 monthly support level last week. Will price continue to decline and move below the 0.6826 monthly support level this week?
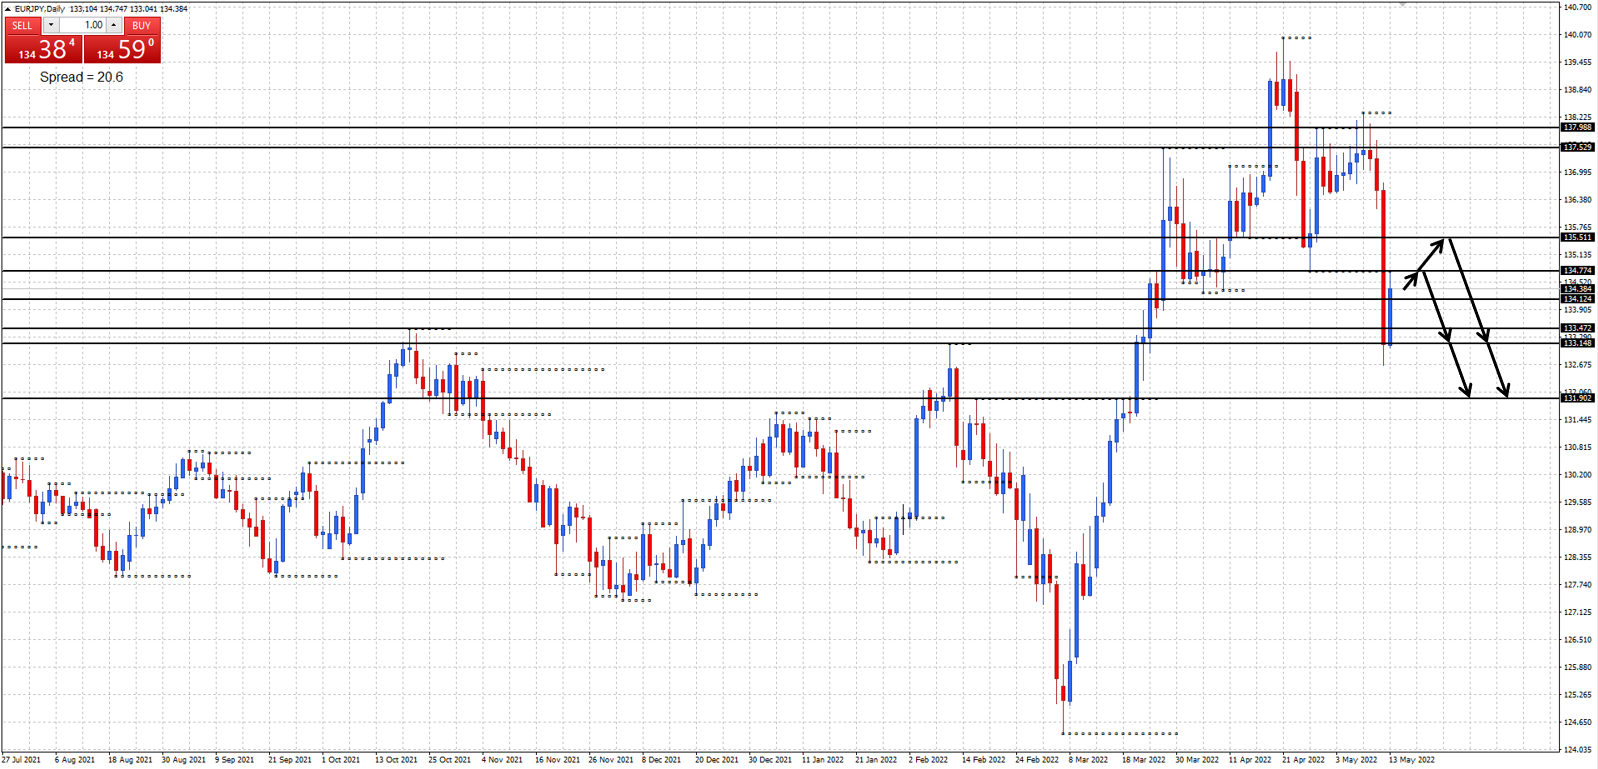
EUR/JPY daily chart
Monthly support at 134.12 and 133.47, resistance at 137.49.
Weekly support at 133.14, resistance at 137.52.
Daily support at 131.90, resistance at 134.77, 135.51, and 137.98.
Price declined strongly and tested the 133.14 weekly support level last week. Will price continue to decline and move below the 133.14 weekly support level this week?
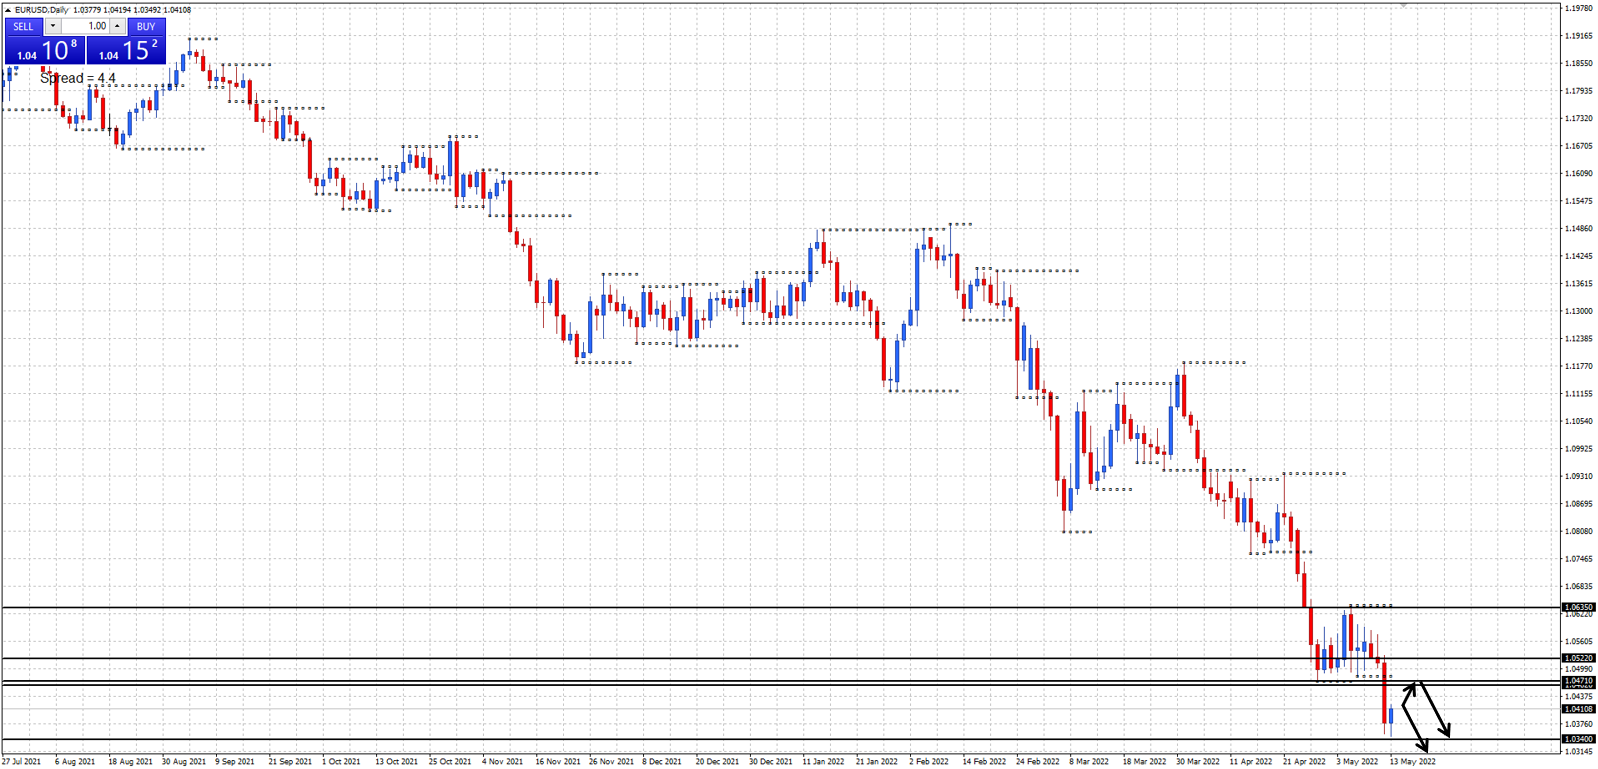
EUR/USD daily chart
Monthly support at 1.0340 and 1.0206, resistance at 1.0462, 1.0522, and 1.0635.
Weekly support at 1.0340, resistance at 1.0462.
Daily support at 1.0340, resistance at 1.0471.
Price almost traded down to the 1.0340 major monthly support level last week. Will price continue to decline and move below the 1.0340 monthly support level this week?
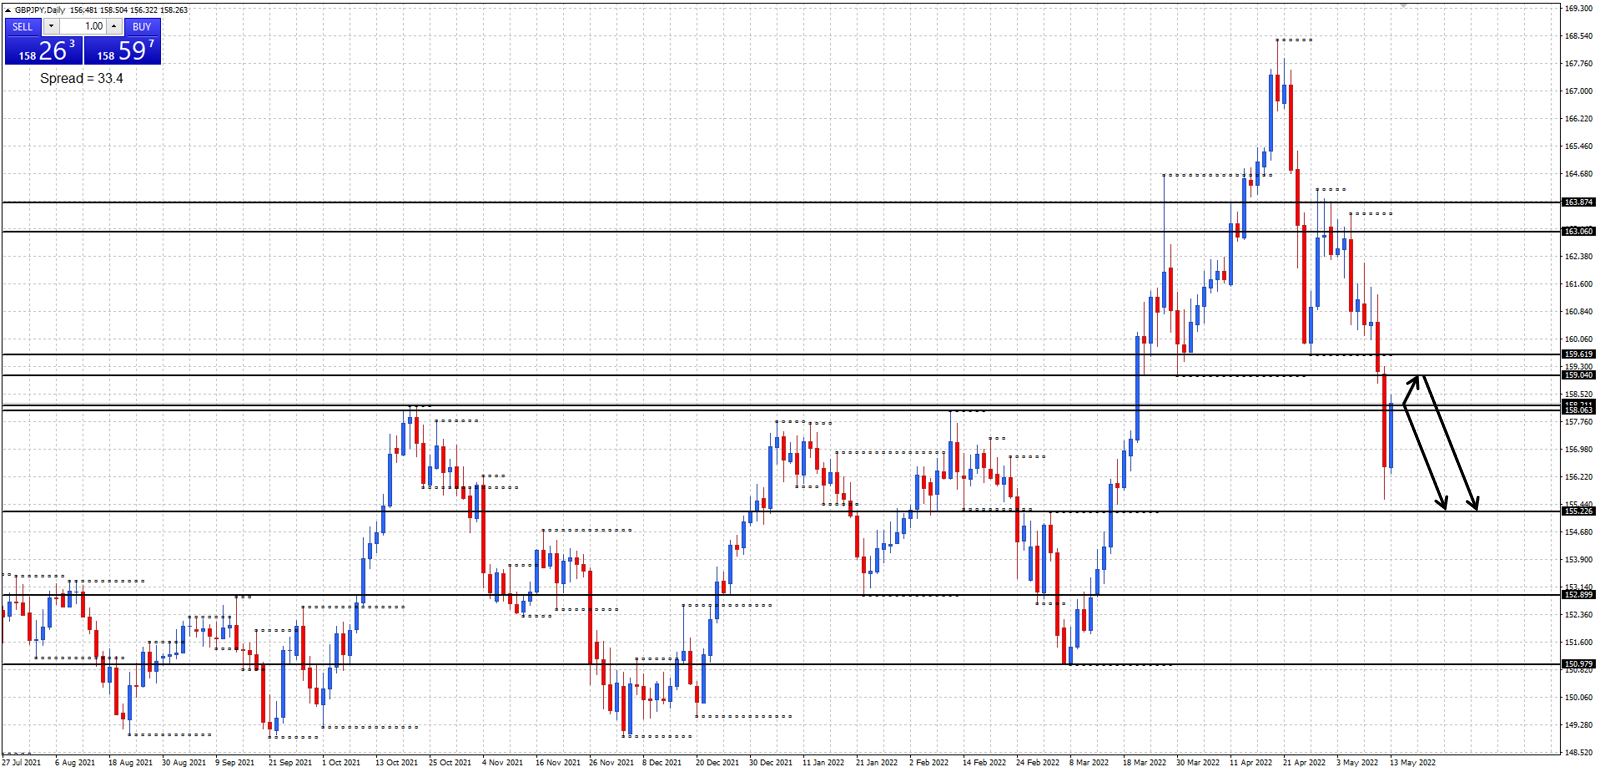
GBP/JPY daily chart
Monthly support at 158.21 and 150.97, resistance at 163.06 and 163.87.
Weekly support at 158.06 and 152.89, resistance at 163.06.
Daily support at 155.22, resistance at 159.04 and 159.61.
Price declined strongly and closed just above the 158.21 monthly support level last week. Will price continue to decline and move below the 158.21 monthly support level this week?
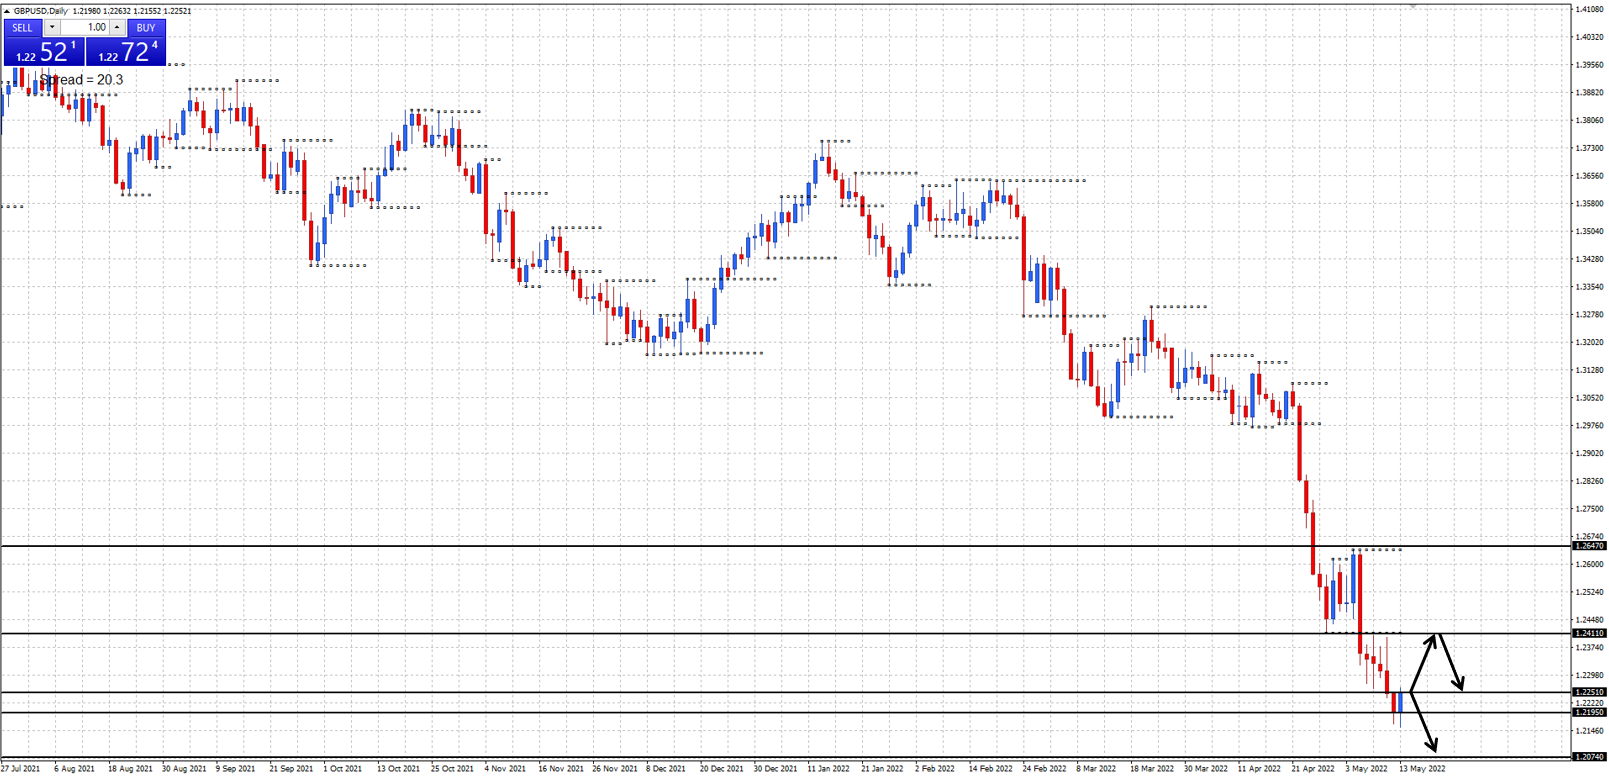
GBP/USD daily chart
Weekly support at 1.2195 and 1.2074, resistance at 1.2251 and 1.2647.
Daily support at 1.2195, resistance at 1.2411.
Price continued to decline and tested the 1.2195 weekly support level last week. Will price continue to decline down and move below the 1.2195 weekly support level this week?
Author

Duncan Cooper
ACY Securities
Duncan Cooper is a full-time trader and mentor. He has been actively trading the financial markets for more than 15 years and has traded stocks, options, futures, and the Forex Market since 2005.


