Key date forecast results April 2022 and year summary

Stock
Market math
3/26/22 – 32,768 music days from the MAJOR 7/08/1932 low. 3/26/22 – 81 (9^2) days from the 1/04/2022 major high. 3/26 was a Saturday. Therefore we go with Monday. 3/28, which was close in price and one day ahead of the high of the month for a credit of two wins. 4/1/22 – 29,193 Music Math days – 4/28/1942 major low. 4/1 was a short term low. 4/15/22 – 16,641(129^2) from 9/22/1976 major high. 4/15 was a Saturday > Monday, 4/18 was a very good low. Score – 4 out of 4 good dates = 100%.
DJIA* – 4/4, 4/11, 4/18, 4/26
4/4 was a pass. 4/11 was not effective. 4/18 was a very good low. 4/26 was very close in price and one day past a good short term high. Score – 2 out of 3 good dates = 66/67%.
Fibonacci – 4/5, 4/9, 4/18, 4/21, 4/29
4/5 was a good high. 4/9 was not effective. 4/18 was a very good low. 4/21 was a very good high. 4/29 was very close in price and one day past a very good high. Score – 4 out of 5 good dates = 80%.
Astro – 3/29, 4/4, 4/6, 4/7, *4/11*, 4/12, 4/18, 4/25, 4/28, 4/29, 4/29 AC
3/29 was the exact high of the month. 4/4 was a pass. 4/6 was very close in price and one day ahead of a short term low. 4/7 was a short term low. 4/11 was not effective. 4/12 was a pass. 4/18 was a good low. 4/25 was a short term low. 4/28 was close in price and one day past a good short term low. 4/29 was very close in price and one day past a very good high. Score – 7 out of 8 good dates = 87.50%.
Total Score – 17 out 20 good dates = 85.00%.
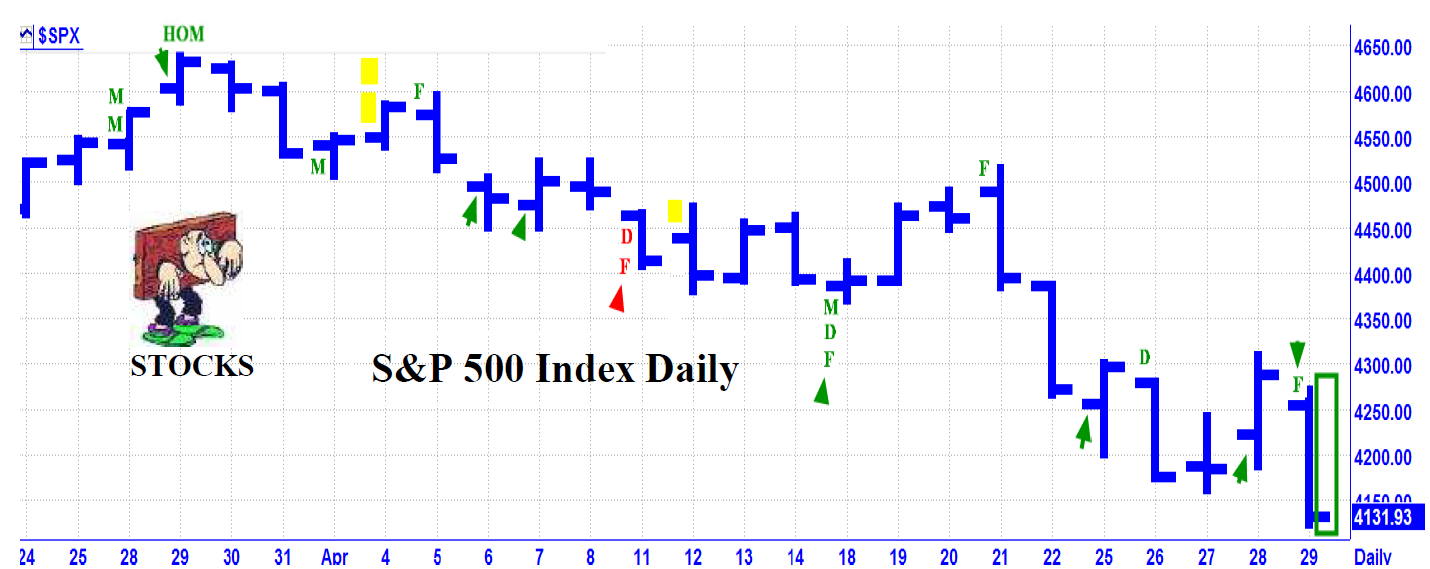
LEGEND: If it is Green it is a winner. If it is Red it is a miss. A Green encircled bar at the end of the month, is still open to evaluation due to a lack of time. A Yellow Bar is a Pass. Astro Date = Arrow. D = DJIA. F = Fibonacci. M = Market Math. N = NYSE. S = S&P. U = US Fed. B = BankEn/Fed. LOM = Low of the Month. HOM = High of the Month.
Author

Norm Winski
Independent Analyst
www.astro-trend.com


