Jobs Friday [Video]
![Jobs Friday [Video]](https://editorial.fxstreet.com/images/Markets/Currencies/Crosses/XAUUSD/gold-bars-on-dollars-19549282_XtraLarge.jpg)
US Dollar: Dec '22 USD is Down at 104.505.
Energies: Jan '23 Crude is Down at 81.06.
Financials: The Mar '23 30 Year T-Bond is Up 6 ticks and trading at 129.22.
Indices: The Dec '22 S&P 500 Emini ES contract is 19 ticks Lower and trading at 4077.00.
Gold: The Feb'23 Gold contract is trading Down at 1813.30. Gold is 19 ticks Lower than its close.
Initial conclusion
This is not a correlated market. The dollar is Down, and Crude is Down which is not normal, but the 30 Year T-Bond is trading Higher. The Financials should always correlate with the US dollar such that if the dollar is lower, then the bonds should follow and vice-versa. The S&P is Lower, and Crude is trading Lower which is not correlated. Gold is trading Lower which is not correlated with the US dollar trading Down. I tend to believe that Gold has an inverse relationship with the US Dollar as when the US Dollar is down, Gold tends to rise in value and vice-versa. Think of it as a seesaw, when one is up the other should be down. I point this out to you to make you aware that when we don't have a correlated market, it means something is wrong. As traders you need to be aware of this and proceed with your eyes wide open. Currently all of Asia is trading Lower. All of Europe is trading Lower with the exception of the German Dax exchange which is Higher.
Possible challenges to traders today
-
Average Hourly Earnings is out at 8:30 AM EST. This is Major.
-
Non-Farm Employment Change is out at 8:30 AM EST. Major.
-
Unemployment Rate is out at 8:30 AM EST. Major.
Treasuries
Traders, please note that we've changed the Bond instrument from the 30 year (ZB) to the 10 year (ZN). They work exactly the same.
We've elected to switch gears a bit and show correlation between the 10-year bond (ZN) and the S&P futures contract. The S&P contract is the Standard and Poor's, and the purpose is to show reverse correlation between the two instruments. Remember it's likened to a seesaw, when up goes up the other should go down and vice versa.
Yesterday the Bonds hit a Low at around 10:30 AM EST. The S&P hit a High at around that time and the Bonds moved Higher shortly thereafter. If you look at the charts below ZN gave a signal at around 10:30 AM and the S&P gave a signal at around the same time. Look at the charts below and you'll see a pattern for both assets. ZN hit a Low at around 10:30 AM and the S&P moved Lower shortly thereafter. These charts represent the newest version of MultiCharts and I've changed the timeframe to a 15-minute chart to display better. This represented a Long opportunity on the 10-year note, as a trader you could have netted about 30 ticks per contract on this trade. Each tick is worth $15.625. Please note: the front month for the ZN is now Dec '22. The S&P contract is also Dec' 22. I've changed the format to Renko Bars such that it may be more apparent and visible.
Charts courtesy of MultiCharts built on an AMP platform
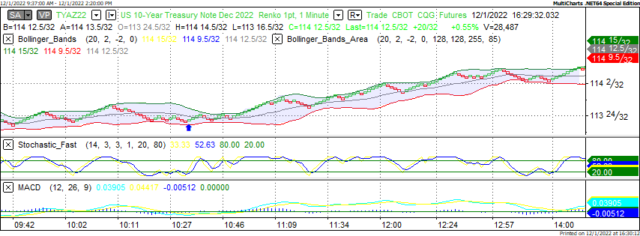
ZN - Dec 2022 - 12/01/22
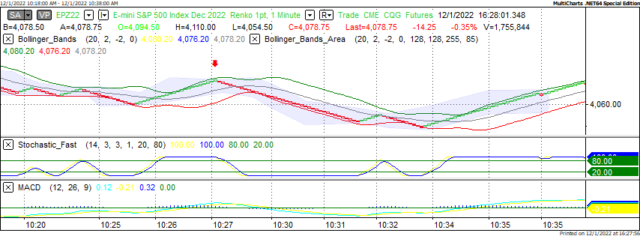
S&P - Dec 2022 - 12/01/22
Bias
Yesterday we gave the markets a Downside bias as only the USD was trading Lower Thursday morning and everything else was Higher. This usually reflects a Downside Day and the markets mostly didn't disappoint. The Dow closed Lower by 195 points, the S&P Lower by 4 but the Nasdaq closed Higher by about 14. Given that today is Jobs Friday our bias is Neutral or Mixed.
Could this change? Of Course. Remember anything can happen in a volatile market.
Commentary
Yesterday we had fairly decent economic reports in that Unemployment Claims were Lower (which is positive) and Personal Income and Spending were both Higher as well and this is good because consumer spending is the major substance of a robust economy. So, if the economic news was good why did the markets falter yesterday? My only answer to that is "it was correlated that way." Any follower of this newsletter should know that over the course of time rules of market correlation override simple logic. This has been the major reason as why certain things happen that don't at first glance make any sense. Do these rules work 100% of the time? No. Anyone who tells you their stuff works 100 percent of the time isn't being honest. Today our bias is Neutral because it is Jobs' Friday and historically speaking the markets have never behaved with any sense of normalcy on this day.
Author

Nick Mastrandrea
Market Tea Leaves


