Job numbers derail markets [Video]
![Job numbers derail markets [Video]](https://editorial.fxstreet.com/images/TechnicalAnalysis/Intermarket/Correlation/it-must-work-gm537868515-58464346.jpg)
US Dollar: Mar '23 USD is Down at 103.975.
Energies: Apr '23 Crude is Down at 75.30.
Financials: The Jun '23 30 Year T-Bond is Up 38 ticks and trading at 130.17.
Indices: The Mar '23 S&P 500 emini ES contract is 32 ticks Higher and trading at 3871.00.
Gold: The Apr'23 Gold contract is trading Up at 1890.20. Gold is 226 ticks Higher than its close.
Initial conclusion
This is not a correlated market. The dollar is Down, and Crude is Down which is not normal, and the 30 Year T-Bond is trading Higher. The Financials should always correlate with the US dollar such that if the dollar is Higher, then the bonds should follow and vice-versa. The S&P is Higher, and Crude is trading Lower which is correlated. Gold is trading Higher which is correlated with the US dollar trading Down. I tend to believe that Gold has an inverse relationship with the US Dollar as when the US Dollar is down, Gold tends to rise in value and vice-versa. Think of it as a seesaw, when one is up the other should be down. I point this out to you to make you aware that when we don't have a correlated market, it means something is wrong. As traders you need to be aware of this and proceed with your eyes wide open. At the present time all of Asia is trading Mixed with half the exchanges Higher and the other half Lower. Currently all of Europe is trading Lower.
Possible challenges to traders today
-
No Major Economic News to speak of.
-
Lack of Major Economic News.
Treasuries
Traders, please note that we've changed the Bond instrument from the 30 year (ZB) to the 10 year (ZN). They work exactly the same.
We've elected to switch gears a bit and show correlation between the 10-year bond (ZN) and the S&P futures contract. The S&P contract is the Standard and Poor's, and the purpose is to show reverse correlation between the two instruments. Remember it's likened to a seesaw, when up goes up the other should go down and vice versa.
On Friday the ZN hit a Low at around 9 AM EST. The S&P was trading Higher at around the same time. If you look at the charts below ZN gave a signal at around 9 AM and the S&P gave a signal at around the same time. Look at the charts below and you'll see a pattern for both assets. ZN hit a Low at around 9 AM and migrated Higher. These charts represent the newest version of MultiCharts and I've changed the timeframe to a 15-minute chart to display better. This represented a Long opportunity on the 10-year note, as a trader you could have netted about 50 ticks per contract on this trade. Each tick is worth $15.625. Please note: the front month for the ZN is now Jun '23. The S&P contract is still Mar' 23. I've changed the format to filled Candlesticks (not hollow) such that it may be more apparent and visible.
Charts courtesy of MultiCharts built on an AMP
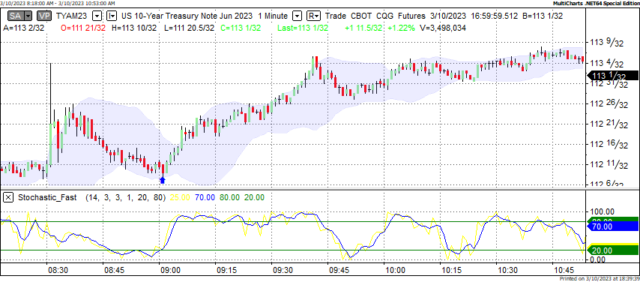
ZN - Jun 2023 - 3/10/23
-638143034365056403.png)
S&P - Mar 2023 - 3/10/23
Bias
On Friday we gave the markets a Neutral or Mixed bias as it was Jobs Friday, and we always maintain a Neutral bias on that day. Why? Because the markets have never shown any sense of normalcy on that day. This past Friday was no exception. The Dow traded Lower by 345 points and the other indices traded Lower as well. Today we aren't dealing with a correlated market and our bias is Neutral or Mixed.
Could this change? Of Course. Remember anything can happen in a volatile market.
Commentary
Another Jobs Friday has come and gone with the US economy creating 311,000 net new jobs last month, which exceeded the forecasted rate of 224,000. You would think that by all estimates the markets would celebrate this. Wrong. The Dow dropped 345 points and the other indices lost ground as well. Why? Because traders and the Smart Money are afraid the Federal Reserve will hike rates even Higher than 25 basis points predicted. The markets are reacting to what they think the Fed will do. So, it's all based on perception, not reality. The thing is the financial markets are one of the few places where perception becomes reality. Today we have no economic news to drive the markets one way or another, so the markets will rely on its own devices today.
Author

Nick Mastrandrea
Market Tea Leaves
Nick Mastrandrea over 20 years experience in trading and formerly held a NASD Series 7. He currently holds a NJ Life, Health and Variable Authority. Nick is a published writer and his work has appeared in Futures Magazine, TraderPlanet and others.


