Japanese Yen: The mistake most traders keep making

Most traders stare at price charts all day and wonder why they're always one step behind.
They focus on what happened, but never ask why it happened.
That's a problem.
Price action and technical analysis are valuable, but they only answer the WHEN.
Macro flows answer the WHY.
And if you ignore the "why," you're trading with one eye closed.
That's why I monitor four macro flow indicators every week:
- Commitment of Traders (CoT).
- Intermarket flows.
- Seasonals.
- Sentiment.
Today, let's look at the Japanese Yen.
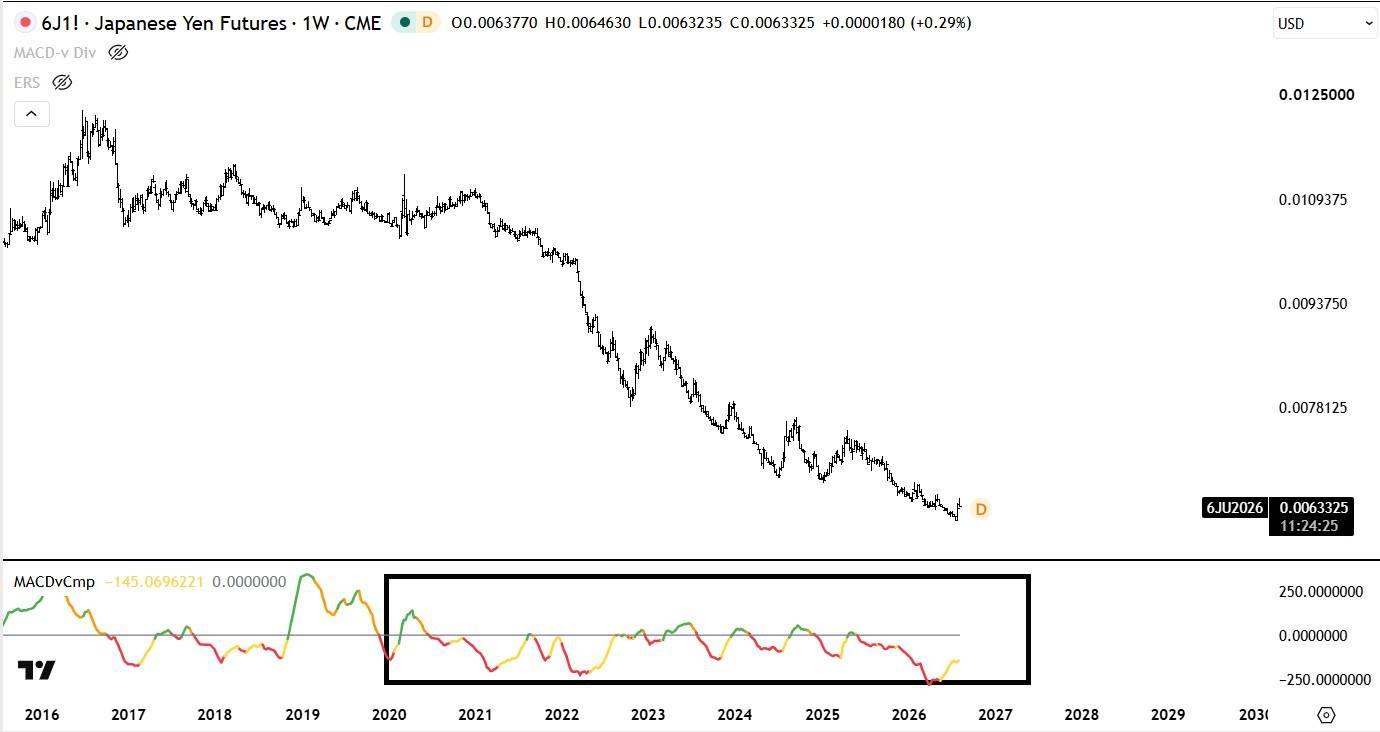
The chart at the top shows Japanese yen futures on a weekly timeframe.
The indicator below is a composite intermarket model built from Japanese Government Bonds (JGBs) and Crude Oil.
Why those two markets?
Because higher JGB yields often strengthen the yen, while higher crude oil prices tend to weaken it.
When JGBs outperform crude oil, the indicator rises ... and the yen often follows.
Since 2020, this indicator has remained below zero, signaling a persistently negative backdrop, interrupted only by brief rallies when momentum turns positive.
Of course, I never rely on a single factor.
I confirm the story with CoT data, seasonals, sentiment, and finally, the technical picture.
Multiple timeframes / Multiple factors (MTMF)
Better decisions.
Author

Alex Spiroglou, CFTe, DipTA (ATAA)
Independent Analyst
Alex Spiroglou is a quasi-systematic, cross-asset proprietary futures trader. His involvement with capital markets began in 1998, having worked for various proprietary trading and investment management firms in the UK and Greece.















