Japanese yen moving towards strengthening

On Monday, November 16th, USD/JPY is falling and mainly trading towards 104.55. The Yen is back to strengthening after the world faced a very unpleasant fact: the second wave of the COVID-19 pandemic is spreading much faster than expected, particularly in Europe and the USA.
At the same time, the statistics from Japan are still looking rather weak: the Bank of Japan’s lack of monetary tools of the fiscal stimulus with an immediate and visible effect is making the country’s economy slide toward crisis. For example, the Industrial Production in Japan added 3.9% m/m in September against the expected reading of +4.0% m/m. On YoY, the indicator showed -9.0%, the same as expected.
The Yen is in demand right now as a “safe haven” asset because the coronavirus attack rate during the second wave of the COVID-19 pandemic is much higher than everyone expected earlier. From the fundamental point of view, if all the elements of this equation remain the same, the Yen has chances to get even stronger than it is now.
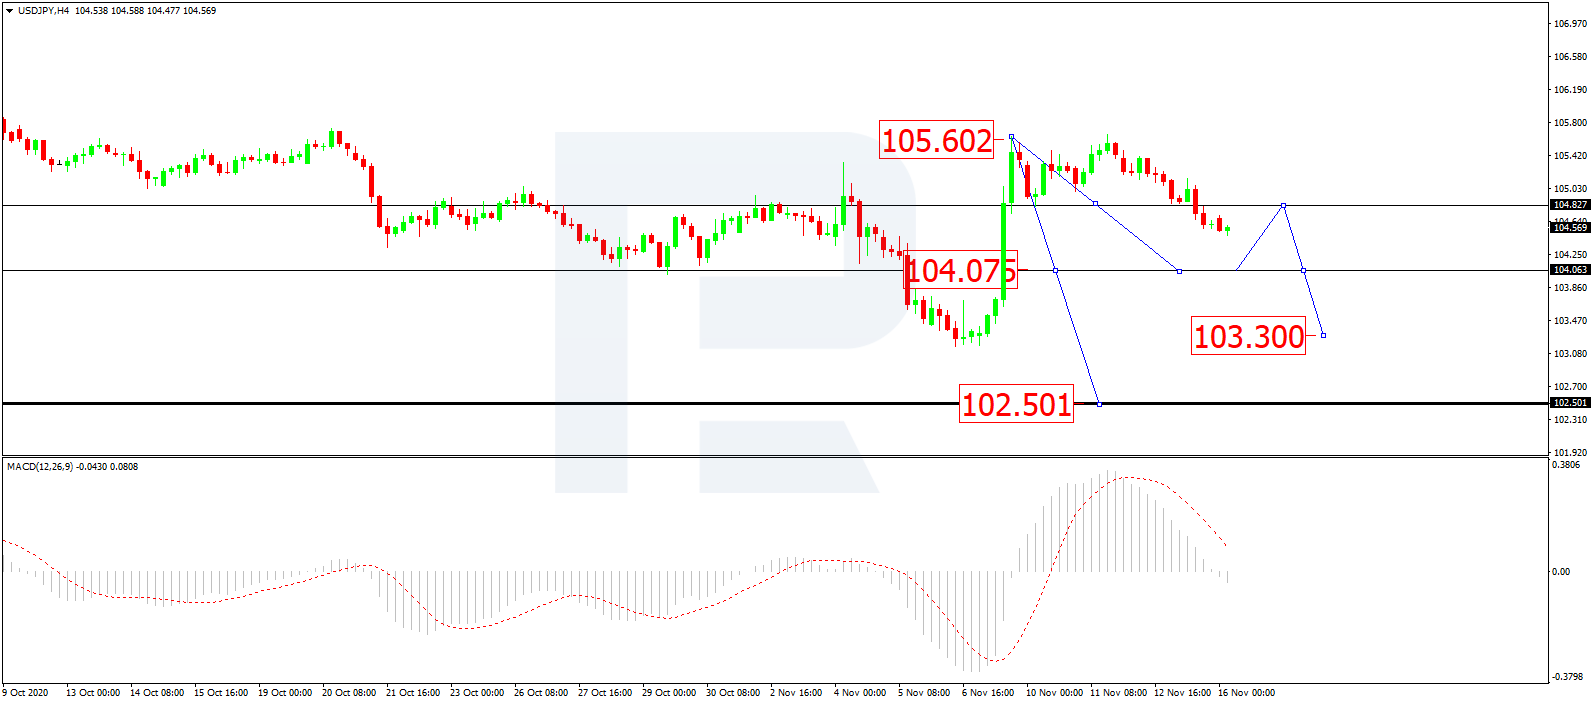
As we can see in the H4 chart, after forming the consolidation range around 104.80 and then breaking it to the downside, USD/JPY is expected to continue forming the fifth descending wave with the target at 102.50; right now, it is forming the first structure of this wave. Possibly, today the pair may fall to reach 104.00 and then start a new correction to return to 104.80. Later, the market may resume trading downwards with the short-term target at 103.30. From the technical point of view, this “bearish” scenario is confirmed by MACD Oscillator: its signal line is falling towards 0. After the line breaks 0, the price may boost its decline.
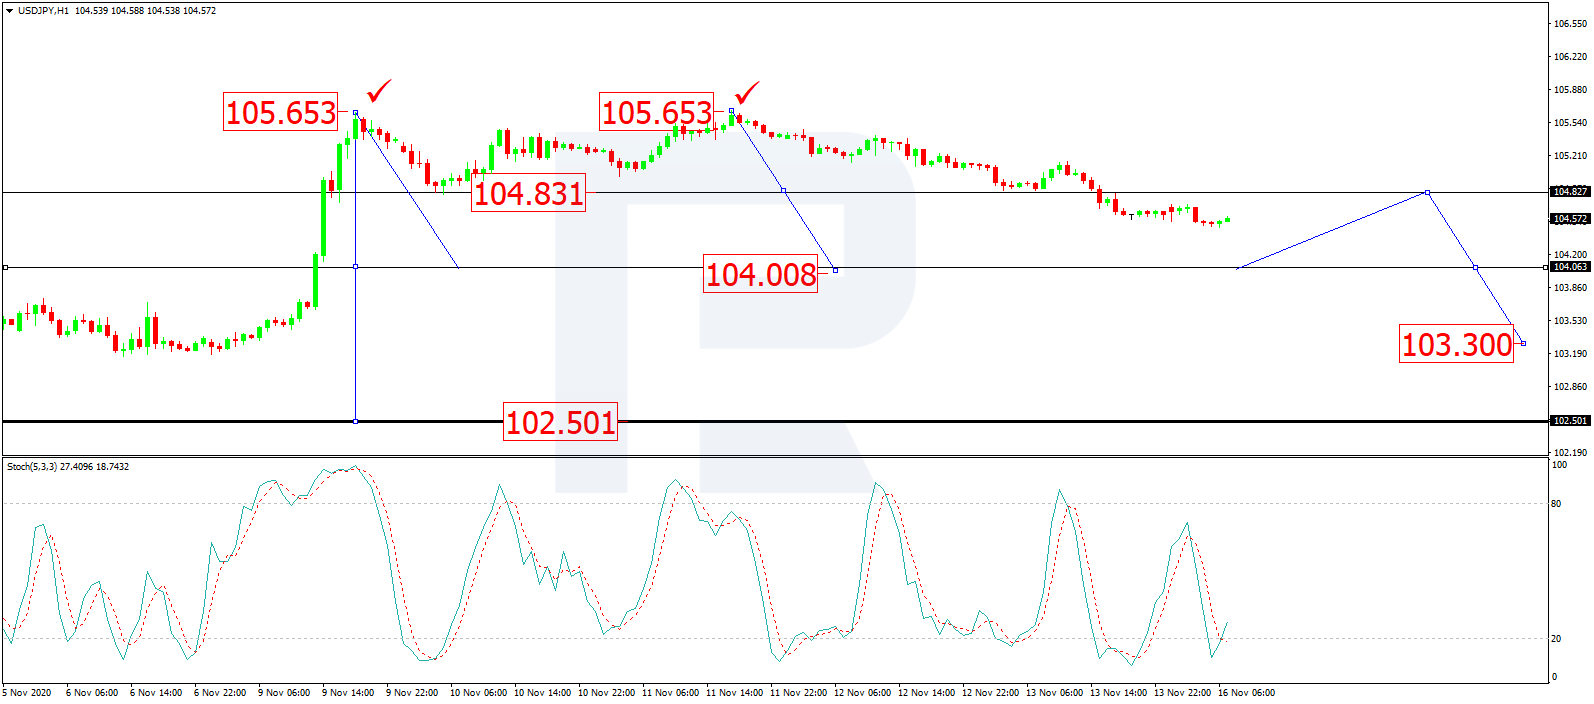
In the H1 chart, after completing the first descending structure at 104.82 along with the correction towards 105.65, USD/JPY has broken the low of the first structure and may later form the third descending structure to break 104.00. After that, the instrument may continue trading downwards with the short-term target at 103.30 and then start a new correction to return to 104.00. From the technical point of view, this scenario is confirmed by Stochastic Oscillator: its signal line is moving not far from 20, thus indicating a correction towards 104.60 on the price chart. The main scenario implies that the line may fall and break 20.
Author

Dmitriy Gurkovskiy
RoboForex
Dmitriy was fond of literature and movies about business, financial markets and psychology since childhood.


