Japanese yen dips to 104 line

The Japanese yen has posted slight gains for a second straight day. Currently, USD/JPY is trading at 104.01, down 0.24% on the day. The yen has recovered most of the losses from early in the week.
The trading week has been particularly short, as Japanese markets were on holiday on Monday, while the US markets were shut on Thursday and many workers are taking off Friday as well. The US dollar gained ground on Monday, as US PMIs for October pointed to stronger growth in the manufacturing and services sectors. Services PMI improved to 57.7, as the index accelerated for a seventh straight month. Manufacturing PMI climbed to 56.7, up considerably from 53.3 beforehand. Both PMIs were well into expansionary territory, which indicates that the economic recovery continues to gain traction.
Over in Japan, this week’s three events were all inflation releases. The Services Producer Price Index (SPPI) came in at -0.6% in October, marking its first decline since May 2013. This was followed by BoJ Core CPI, which is the Bank of Japan’s preferred inflation gauge. The index has hovered close to the zero level for most of 2020, and the trend continued in September, with a reading of 0.0%. The week wrapped up with a sluggish Tokyo Core CPI, which came in at -0.7%, its fourth straight decline.
These soft inflation numbers shouldn’t come as a surprise, as Japan’s economy has been gripped by low inflation for years. The Bank of Japan has stubbornly stuck to its inflation target of around 2 per cent, but this goal appears unrealistic, as the economic activity is weak. Consumers are pessimistic and are holding tight to their purse strings, while manufacturing and exports have been hit hard to lower global demand for Japanese products.
USD/JPY Technical Analysis
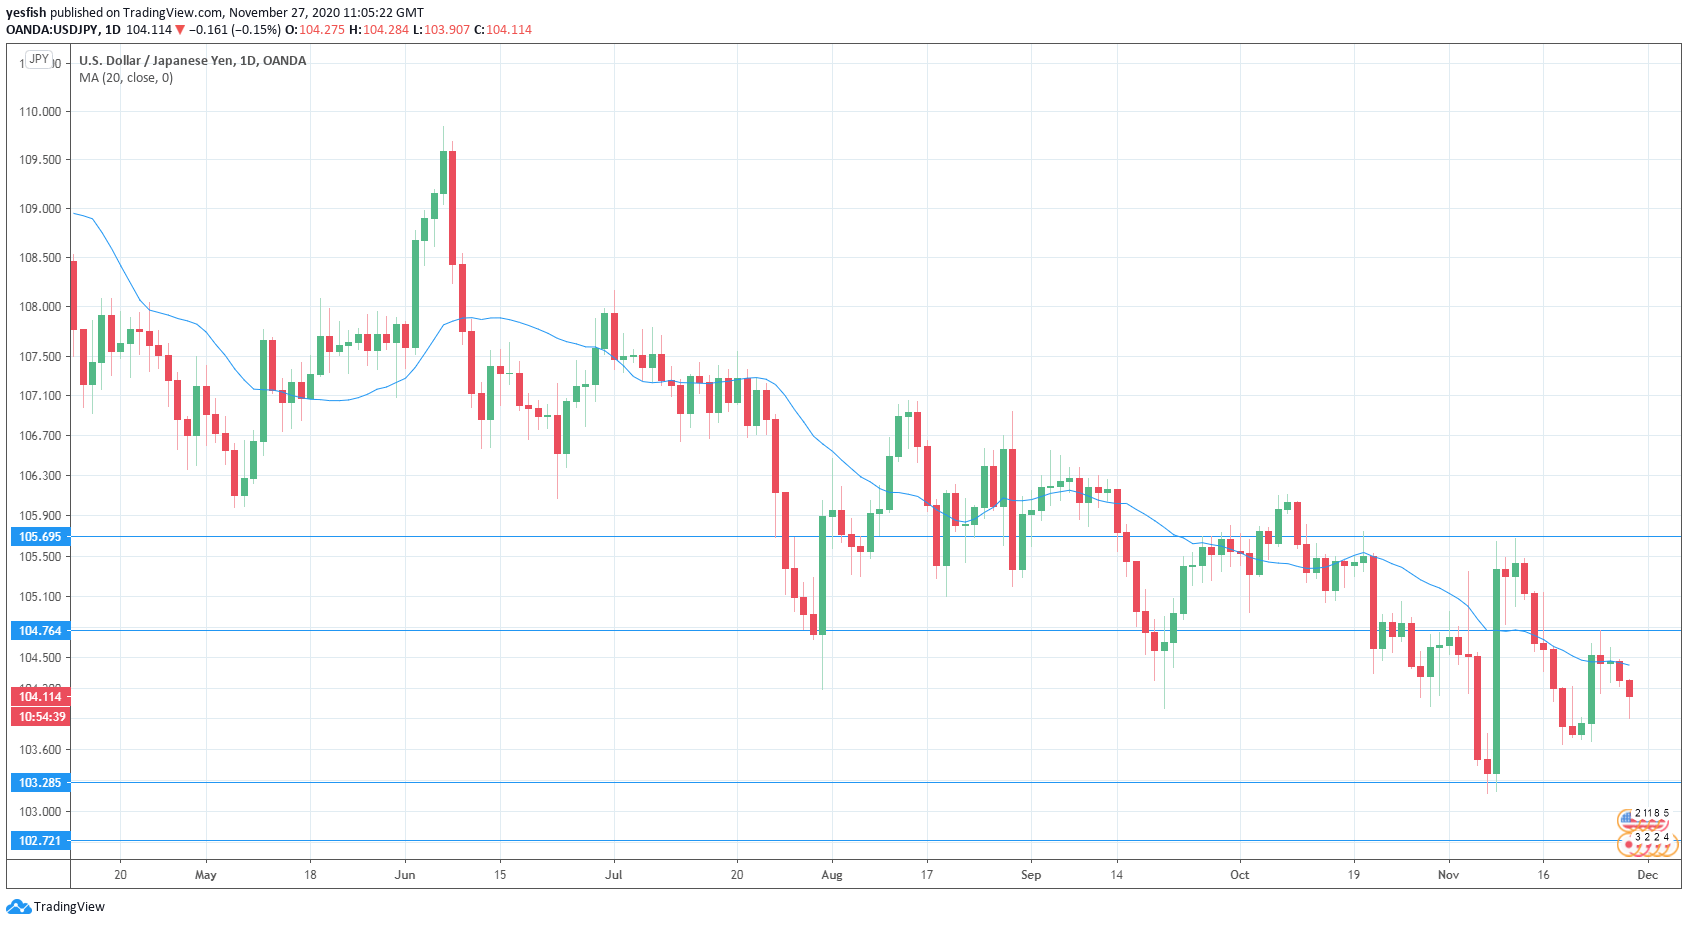
USD/JPY has been range-bound throughout the week.
-
The pair faces resistance at 104.76. This is followed by resistance at 105.69.
-
103.28 is the first line of support. Below, there is support at 102.73.
-
USD/JPY has broken below the 20-day MA line, which indicates a downtrend.
Author

Kenny Fisher
MarketPulse
A highly experienced financial market analyst with a focus on fundamental analysis, Kenneth Fisher’s daily commentary covers a broad range of markets including forex, equities and commodities.


