• Since the mid-1990s the Italian economy has seen a significant economic uncoupling, which has worsened since the 2008 financial crisis.

  • Its difficulties include a level of productivity that is one of the lowest in the advanced economies, a demographic decline and a relatively inefficient labour market, which still excludes too many young people.

  • Structural reforms were introduced under the government of Mario Monti, from 2011 on, bringing a recovery in fiscal and trade accounts, but it remains to be seen what the current government will now do.

How to handle debt at 130% of GDP with no growth? At a time when Italy is seeing a new wave of volatility over its spread1, the persistent sluggishness of its economy is more than ever at the forefront. Since 2012, growth in Italy has averaged 1% per year, compared to 2% for the eurozone as a whole. At the end of 2018 the country's economy slipped back into recession, for the third time in ten years. This lack of economic vigour is far from new (see Chart 1) and its causes are to be found beyond the global crisis of 2008. In the first section of this report, we look at the economy's structural weaknesses and the deterioration of its potential growth rate2.


Struggling for investment and financing

Both the estimated level and the make-up of Italy's potential growth rate3 between 1995 and 2018 suggest a lack of vigour that has no real equivalent in other European Union (EU) countries, and that is also a fairly longstanding concern.

Before 2008, the country's potential growth rate was already only half that of the euro zone as a whole (1% per year on average between 1996 and 2007). The two successive crises (financial and sovereign debt) that followed dragged potential growth rates into negative territory4, and the recovery since 2016 hasHow to handle debt at 130 been hesitant (Chart 1).

fxsoriginal

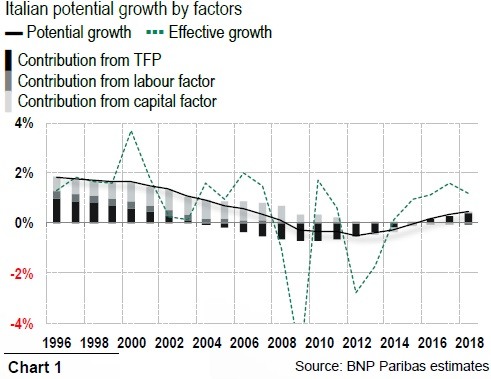
Underlying these two ‘lost decades' is the stagnation of total factor productivity (TFP)5, which is currently at the same level as in 1995 (Chart 2). Over the same period, TFP in Germany and France has risen by nearly 13%. In Spain, although it was flat up until 2013, TFP has since risen markedly.

fxsoriginal

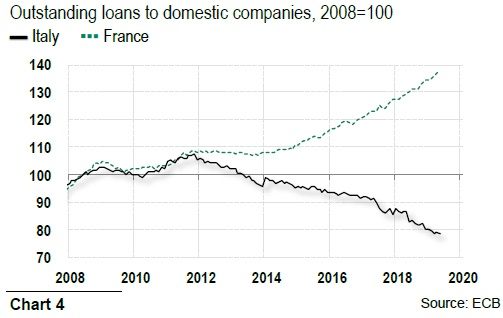
Setting aside structural effects (the expansion of tertiary sector activities, the relatively high weighting of non-merchant public services), the limited gains in productivity in Italy result primarily from a chronic shortfall in investment, with the stock of capital having stopped rising in 2012 (Chart 4).

fxsoriginal

In 2018 gross fixed capital formation by companies (at constant prices) was still at its 1999 level. R&D expenditure has run at only 1.2% of GDP over the past twenty years according to the Organisation for Economic Cooperation and Development (OECD), compared to 2.1% in France for example. Several causes have been identified for this shortfall: the fragmented industrial fabric (95% of which consists of micro-companies), low levels of competition and the focus on sectors with a low technological component6. Most studies show that R&D expenditure rises in line with company sizes, meaning that Italian R&D investment has often fallen below the threshold needed to benefit from technology transfers and access external markets7. As a result, the Digital Economy and Society Index (DESI), developed by the European Commission, ranks Italy 25th of the EU nations, very nearly at the bottom of the pile8.

Lending to companies, which in contrast to the trend seen in other countries, has not recovered in Italy (Chart 4), has been another brake on investment. Following the sovereign debt crisis in the euro zone, and given their exposure to Italian Treasury securities, domestic banks have seen financing costs rise and ratings fall, a phenomenon that has been aggravated by the country's return to recession in 2012-2013 and the deterioration of balance sheet quality. Although the situation has improved since (longer-term loans and asset purchases from the ECB, reduction in the share of nonperforming loans, improvements in solvency ratios, etc.), Italian banks are still suffering from low levels of profitability by European standards, and their ability to finance the economy remains constrained (IMF, 2019)9.

Over and above the shortage of banking resources, their allocation in the post-crisis period has not been efficient. A Bank of Italy study (Schivardi et al, 2017)10 examined how, in order to address tighter prudential standards, banks with low capital (primarily the regional banks) have sought to avoid materializing losses by extending credit to so-called ‘zombie' firms (those whose return on equity stands below their cost of capital). According to the authors, such a misallocation has caused credit restrictions to healthy borrowers and higher probability for them to default.


Labour: a scarce and undervalued resource

Changes in the labour factor in Italy have also contributed to the deterioration of the potential growth rate, despite the reforms of the 1990s and 2010 (including the Jobs Act)11.

Average annual growth in hours worked, which was still positive in the 2000s (at 0.3%), has fallen to zero, and its contribution to potential growth became negative from 2014 on (Chart 4). The reforms helped drive the growth in jobs, but ignored training and education policies. At 22%, the share of people aged 25 to 34 with a university degree is 7 points below the EU average. Moreover, Italy ranks poorly in terms of professional training and adult skill levels (OECD, 201912).

The proportion of the long-term unemployed has remained high and stable, at 60% of the total in 2018, as has structural unemployment. At 10.2% of the active population (European Commission figure), this remains one of the highest rates in the OECD; more importantly, it has not fallen, whilst Spain, Portugal and France have all seen progress in this area recently.

Lastly, the population is ageing (nearly one Italian in four is aged 65 or over, making Italy the second oldest country in the world, after Japan) and the working-age population is shrinking. In addition, Italy's activity rate of 67%, although rising, is one of the lowest in the euro zone (it is 81% in Germany for instance)13. Another unwelcome record is that 29% of young Italians (20 to 34 years old) are neither in employment nor in education or training (NEETs, Eurostat), compared to an EU average of 17%14; 50,000 young people leave the country every year.


Has the output gap already closed?

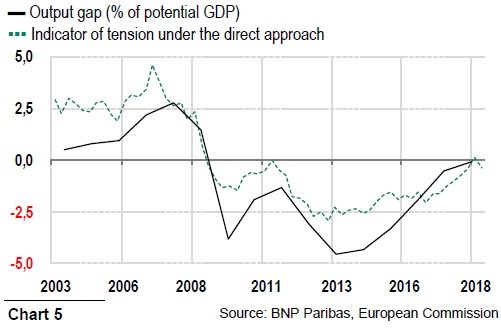
The downtrend in the potential growth rate could mean that although it is now seeing a delayed and modest recovery, the Italian economy is already facing capacity constraints. This would appear to be the European Commission's analysis, when it indicates that the output gap (the difference between GDP and its potential level) narrowed in 2018 (Chart 5). Although a direct approach (see Box 1) tends to confirm this diagnosis, it is far from unanimously accepted. Both the OECD and the International Monetary Fund (IMF) differ from the Commission, and believe that Italy's output gap is still significantly negative.

fxsoriginal

This debate is not just theoretical in nature: the economy's position in the cycle determines the cyclical element of the deficit (that part which increases or decreases due to the automatic stabilisers) and the effectiveness of policies to support demand. In its latest report on Italy, the OECD was fairly favourable regarding the budget target of improving the position of the poorest citizens. But the organisation doubts that a minimum guaranteed income will achieve this without structural measures to improve recipients' inclusion in employment15. Irrespective of their assessment of the economy, all the major institutions – the Commission, IMF and OECD – share the view that to recover, Italy must first reform.

Download The Full Ecoflash

BNP Paribas is regulated by the FSA for the conduct of its designated investment business in the UK and is a member of the London Stock Exchange. The information and opinions contained in this report have been obtained from public sources believed to be reliable, but no representation or warranty, express or implied, is made that such information is accurate or complete and it should not be relied upon as such. This report does not constitute a prospectus or other offering document or an offer or solicitation to buy any securities or other investment. Information and opinions contained in the report are published for the assistance of recipients, but are not to be relied upon as authoritative or taken in substitution for the exercise of judgement by any recipient, they are subject to change without notice and not intended to provide the sole basis of any evaluation of the instruments discussed herein. Any reference to past performance should not be taken as an indication of future performance. No BNP Paribas Group Company accepts any liability whatsoever for any direct or consequential loss arising from any use of material contained in this report. All estimates and opinions included in this report constitute our judgements as of the date of this report. BNP Paribas and their affiliates ("collectively "BNP Paribas") may make a market in, or may, as principal or agent, buy or sell securities of the issuers mentioned in this report or derivatives thereon. BNP Paribas may have a financial interest in the issuers mentioned in this report, including a long or short position in their securities, and or options, futures or other derivative instruments based thereon. BNP Paribas, including its officers and employees may serve or have served as an officer, director or in an advisory capacity for any issuer mentioned in this report. BNP Paribas may, from time to time, solicit, perform or have performed investment banking, underwriting or other services (including acting as adviser, manager, underwriter or lender) within the last 12 months for any issuer referred to in this report. BNP Paribas, may to the extent permitted by law, have acted upon or used the information contained herein, or the research or analysis on which it was based, before its publication. BNP Paribas may receive or intend to seek compensation for investment banking services in the next three months from an issuer mentioned in this report. Any issuer mentioned in this report may have been provided with sections of this report prior to its publication in order to verify its factual accuracy. This report was produced by a BNP Paribas Group Company. This report is for the use of intended recipients and may not be reproduced (in whole or in part) or delivered or transmitted to any other person without the prior written consent of BNP Paribas. By accepting this document you agree to be bound by the foregoing limitations. Analyst Certification Each analyst responsible for the preparation of this report certifies that (i) all views expressed in this report accurately reflect the analyst's personal views about any and all of the issuers and securities named in this report, and (ii) no part of the analyst's compensation was, is, or will be, directly or indirectly, related to the specific recommendations or views expressed herein. United States: This report is being distributed to US persons by BNP Paribas Securities Corp., or by a subsidiary or affiliate of BNP Paribas that is not registered as a US broker-dealer, to US major institutional investors only. BNP Paribas Securities Corp., a subsidiary of BNP Paribas, is a broker-dealer registered with the Securities and Exchange Commission and is a member of the National Association of Securities Dealers, Inc. BNP Paribas Securities Corp. accepts responsibility for the content of a report prepared by another non-US affiliate only when distributed to US persons by BNP Paribas Securities Corp. United Kingdom: This report has been approved for publication in the United Kingdom by BNP Paribas London Branch, a branch of BNP Paribas whose head office is in Paris, France. BNP Paribas London Branch is regulated by the Financial Services Authority ("FSA") for the conduct of its designated investment business in the United Kingdom and is a member of the London Stock Exchange. This report is prepared for professional investors and is not intended for Private Customers in the United Kingdom as defined in FSA rules and should not be passed on to any such persons. Japan: This report is being distributed to Japanese based firms by BNP Paribas Securities (Japan) Limited, Tokyo Branch, or by a subsidiary or affiliate of BNP Paribas not registered as a financial instruments firm in Japan, to certain financial institutions permitted by regulation. BNP Paribas Securities (Japan) Limited, Tokyo Branch, a subsidiary of BNP Paribas, is a financial instruments firm registered according to the Financial Instruments and Exchange Law of Japan and a member of the Japan Securities Dealers Association. BNP Paribas Securities (Japan) Limited, Tokyo Branch accepts responsibility for the content of a report prepared by another non-Japan affiliate only when distributed to Japanese based firms by BNP Paribas Securities (Japan) Limited, Tokyo Branch. Hong Kong: This report is being distributed in Hong Kong by BNP Paribas Hong Kong Branch, a branch of BNP Paribas whose head office is in Paris, France. BNP Paribas Hong Kong Branch is regulated as a Licensed Bank by the Hong Kong Monetary Authority and is deemed as a Registered Institution by the Securities and Futures Commission for the conduct of Advising on Securities [Regulated Activity Type 4] under the Securities and Futures Ordinance Transitional Arrangements. Singapore: This report is being distributed in Singapore by BNP Paribas Singapore Branch, a branch of BNP Paribas whose head office is in Paris, France. BNP Paribas Singapore is a licensed bank regulated by the Monetary Authority of Singapore is exempted from holding the required licenses to conduct regulated activities and provide financial advisory services under the Securities and Futures Act and the Financial Advisors Act. © BNP Paribas (2011). All rights reserved.

Recommended Content


Recommended Content

Editors’ Picks

AUD/USD posts gain, yet dive below 0.6500 amid Aussie CPI, ahead of US GDP

AUD/USD posts gain, yet dive below 0.6500 amid Aussie CPI, ahead of US GDP

The Aussie Dollar finished Wednesday’s session with decent gains of 0.15% against the US Dollar, yet it retreated from weekly highs of 0.6529, which it hit after a hotter-than-expected inflation report. As the Asian session begins, the AUD/USD trades around 0.6495.

AUD/USD News

USD/JPY finds its highest bids since 1990, approaches 156.00

USD/JPY finds its highest bids since 1990, approaches 156.00

USD/JPY broke into its highest chart territory since June of 1990 on Wednesday, peaking near 155.40 for the first time in 34 years as the Japanese Yen continues to tumble across the broad FX market. 

USD/JPY News

Gold stays firm amid higher US yields as traders await US GDP data

Gold stays firm amid higher US yields as traders await US GDP data

Gold recovers from recent losses, buoyed by market interest despite a stronger US Dollar and higher US Treasury yields. De-escalation of Middle East tensions contributed to increased market stability, denting the appetite for Gold buying.

Gold News

Ethereum suffers slight pullback, Hong Kong spot ETH ETFs to begin trading on April 30

Ethereum suffers slight pullback, Hong Kong spot ETH ETFs to begin trading on April 30

Ethereum suffered a brief decline on Wednesday afternoon despite increased accumulation from whales. This follows Ethereum restaking protocol Renzo restaked ETH crashing from its 1:1 peg with ETH and increased activities surrounding spot Ethereum ETFs.

Read more

Dow Jones Industrial Average hesitates on Wednesday as markets wait for key US data

Dow Jones Industrial Average hesitates on Wednesday as markets wait for key US data

The DJIA stumbled on Wednesday, falling from recent highs near 38,550.00 as investors ease off of Tuesday’s risk appetite. The index recovered as US data continues to vex financial markets that remain overwhelmingly focused on rate cuts from the US Fed.

Read more

Majors

Cryptocurrencies

Signatures