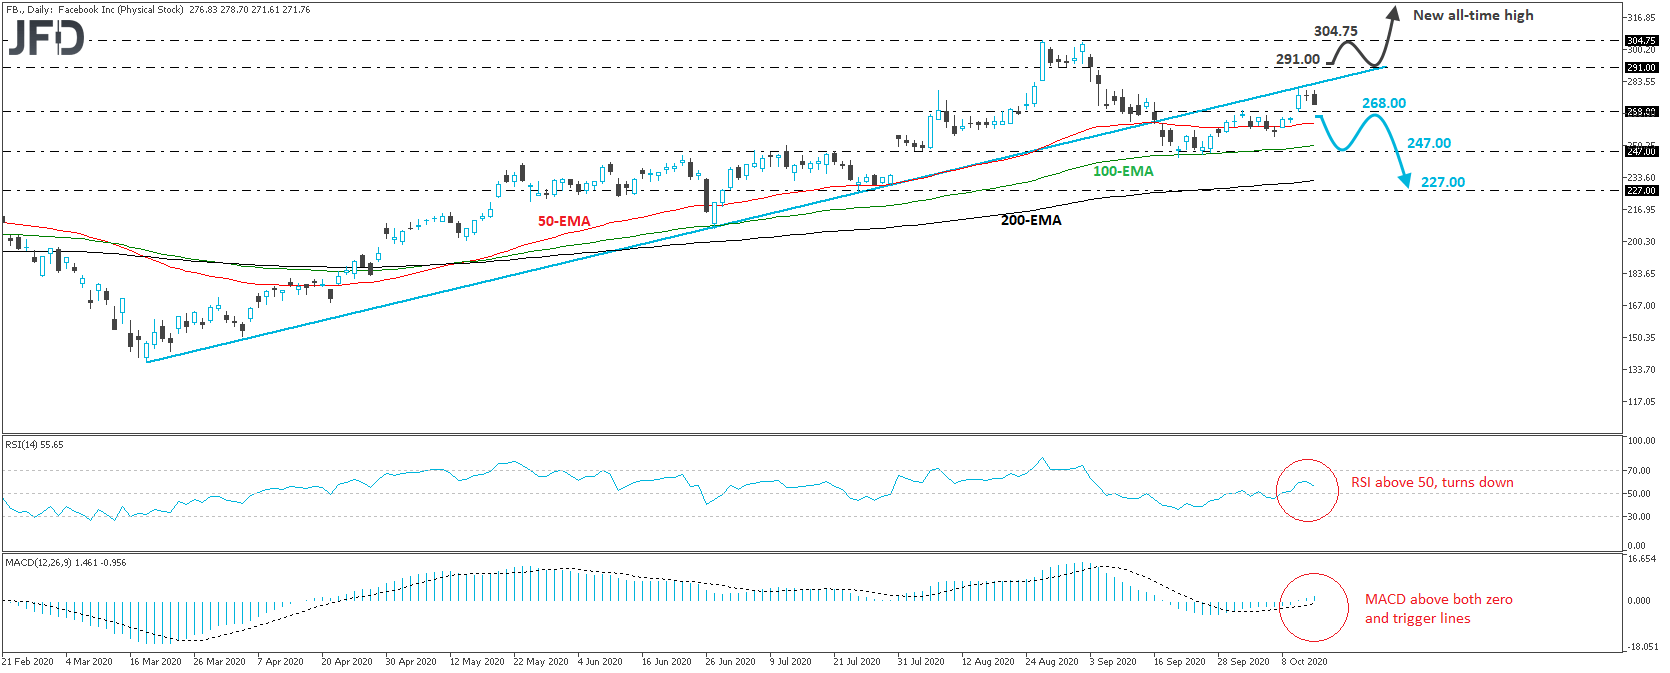
Facebook Inc. (NASDAQ: FB) traded lower on Wednesday, after it hit resistance on Monday near the prior upside support line drawn from the low of March 18th. Although the price is back above all three of our moving averages on the daily chart, the fact that it retreated after hitting that prior upside line suggests that more declines may be in the works.
However, in order to get confident on that front, we would like to see a decisive dip below the 268.00 zone, which is marked as a support by the inside swing high of October 1st. In case this happens, we may see FB sliding towards the 247.00 zone, which provided decent support between September 21st and 25th, and also acted as a resistance between July 7th and 21st. The price could temporarily rebound from there, but if it’s unable to climb back above the pre-mentioned upside line, we may see another drop, perhaps below 247.00 this time. This is when the price may slide to 227.00, which is the low of July 24th.
Shifting attention to our daily oscillators, we see that the RSI, although above 50, has turned down, but the MACD remains above both its zero and trigger lines. Both indicators still point to upside momentum, albeit a slowing one, and that’s why we prefer to wait for a dip below 268.00 before we start examining the downside scenario.
On the upside, a break above 291.00 is the move that could brighten the stock’s outlook. The share would already be above the aforementioned upside line, with investors perhaps aiming for the record peak of 304.75, hit on August 26th. If that level does not hold this time around, then investors will have to deal with levels not seen before and establish new resistance zones.
JFDBANK.com - One-stop Multi-asset Experience for Trading and Investment Services
The content we produce does not constitute investment advice or investment recommendation (should not be considered as such) and does not in any way constitute an invitation to acquire any financial instrument or product. JFD Group, its affiliates, agents, directors, officers or employees are not liable for any damages that may be caused by individual comments or statements by JFD Group analysts and assumes no liability with respect to the completeness and correctness of the content presented. The investor is solely responsible for the risk of his investment decisions. Accordingly, you should seek, if you consider appropriate, relevant independent professional advice on the investment considered. The analyses and comments presented do not include any consideration of your personal investment objectives, financial circumstances or needs. The content has not been prepared in accordance with the legal requirements for financial analyses and must therefore be viewed by the reader as marketing information. JFD Group prohibits the duplication or publication without explicit approval.
72,99% of the retail investor accounts lose money when trading CFDs with this provider. You should consider whether you can afford to take the high risk of losing your money. Please read the full Risk Disclosure: https://www.jfdbank.com/en/legal/risk-disclosure
Recommended Content
Editors’ Picks
EUR/USD trades weak below 1.0800 amid Good Friday lull, ahead of US PCE
EUR/USD remains depressed below 1.0800 after soft French inflation data, amid minimal volatility and thin liquidity on Good Friday. The pair keenly awaits the US PCE inflation data and Fed Chair Powell's speech for fresh hints on next week's price action.
GBP/USD holds steady above 1.2600 as markets stay calm on Good Friday
GBP/USD trades sideways above 1.2600 amid a typical Good Friday trading lull. A broadly firmer US Dollar could keep any upside attempts limited in the pair ahead of the US PCE inflation data and Fed Chair Powell's appearance.
Gold price sits at all-time highs above $2,230, US PCE eyed
Gold price hit all-time highs at $2,236 on Thursday to finish Q1 2024 with a bang. Most major world markets, including the US are closed due to Holy Friday, leaving volatility around Gold price highly subdued. US PCE inflation and Powell are awaited.
Jito price could hit $6 as JTO coils up inside this bullish pattern
Jito (JTO) price has been on an uptrend since forming a local bottom in early January. Since then, JTO has revisited the key swing point formed in early December, suggesting the bulls’ intention to move higher.
Key events in developed markets next week
Next week, the main focus will be inflation and the labour market in the Eurozone. We expect services inflation to be impacted by the easter effect, while the unemployment rate to be unchanged.