|

Is EUR/JPY overbought? [Video]

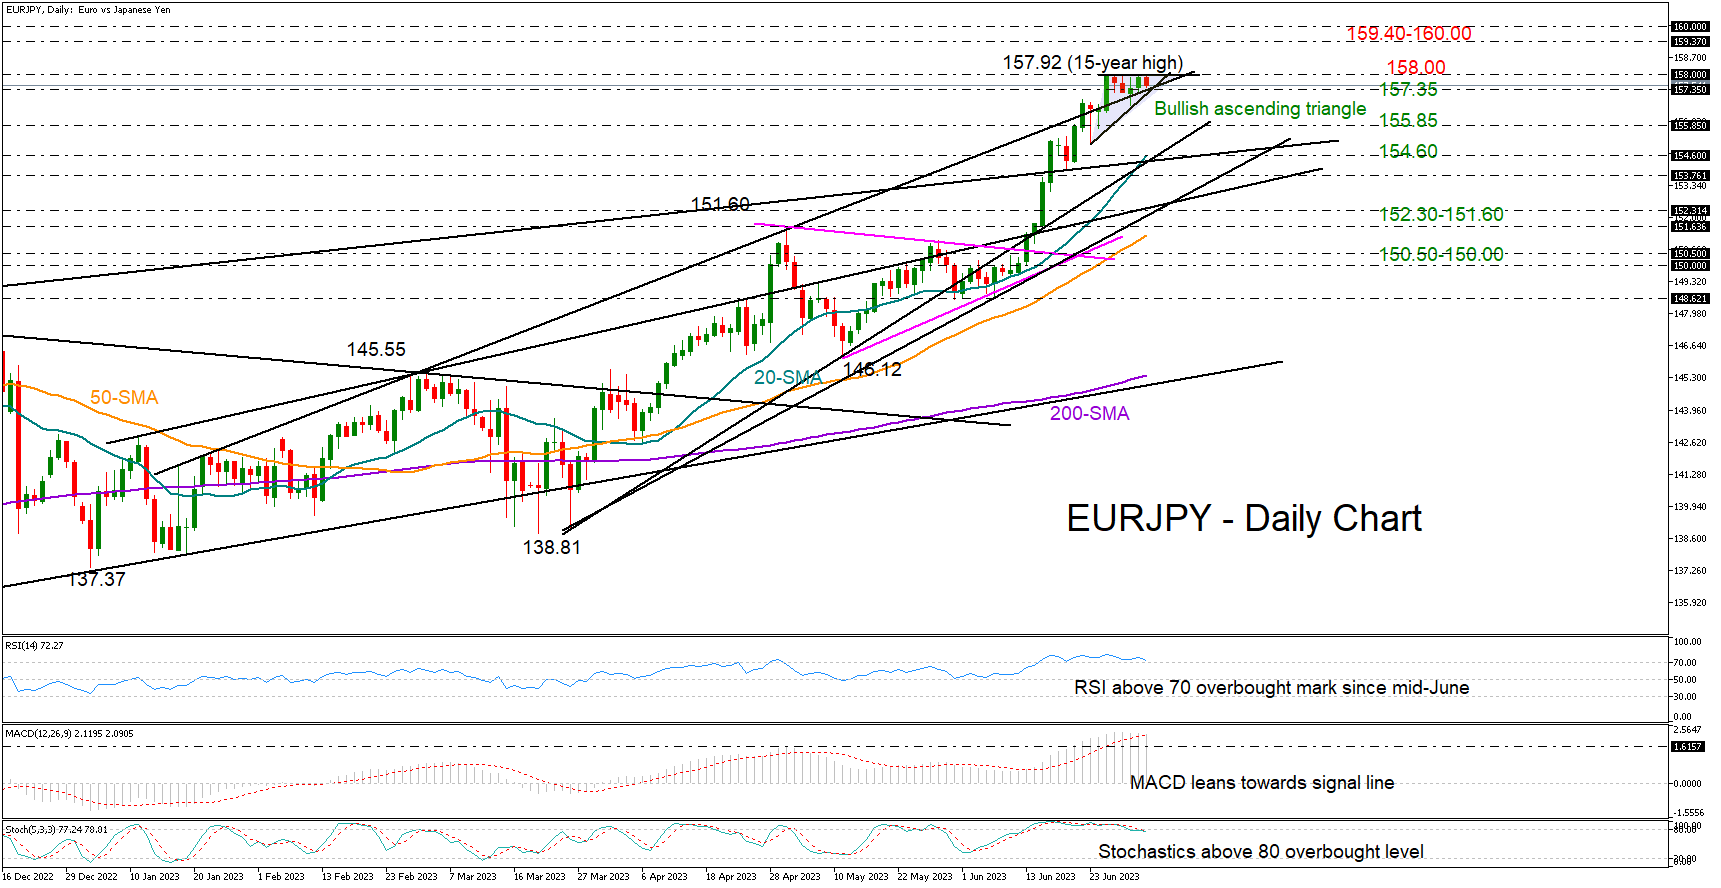
EURJPY bulls ran out of fuel after unlocking a 15-year high of 157.92 last week. 

The pair remained trapped below the 158.00 ceiling for the fifth consecutive trading day, increasing speculation that the latest fast rally might have matured. The RSI and the stochastic oscillator have been moving sideways within the overbought zone since mid-June in the daily, weekly and monthly timeframes, backing this narrative too.

The market structure in the very short-term picture, however, seems to be taking the shape of an ascending triangle, which is typically a bullish continuation pattern. If the price exits the triangle on the upside, resistance could next commence within the 159.40-160.00 constraining zone last active during the 2007-2008 period. Another leg higher could pause somewhere between 162.50 and 163.00.

In the event the price slides below the 157.35 floor, where the triangle’s lower trendline intersects the broken resistance line from January 18th, selling pressures could intensify towards the 155.85 handle. Another defeat there could threaten a plunge towards the 20-day simple moving average (SMA) and the broken long-term ascending line from August 2020 at 154.45.

All in all, EURJPY could end lower on profit-taking in the short term. Yet, as long as the price trades above the 157.35 base, there is potential for a rally aiming for the 160.00 psychological mark.

Chart

Author

Christina Parthenidou

Christina joined the XM investment research department in May 2017. She holds a master degree in Economics and Business from the Erasmus University Rotterdam with a specialization in International economics.

More from Christina Parthenidou
Share:

Markets move fast. We move first.

Orange Juice Newsletter brings you expert driven insights - not headlines. Every day on your inbox.

By subscribing you agree to our Terms and conditions.

Editor's Picks

EUR/USD bounces toward 1.1750 as US Dollar loses strength

EUR/USD returned to the 1.1750 price zone in the American session on Friday, despite falling Wall Street, which indicates risk aversion. Trading conditions remain thin following the New Year holiday and ahead of the weekend, with the focus shifting to US employment and European data scheduled for next week.

GBP/USD nears 1.3500, holds within familiar levels

After testing 1.3400 on the last day of 2025, GBP/USD managed to stage a rebound. Nevertheless, the pair finds it difficult to gather momentum and trades with modest intraday gains at around 1.3490 as market participants remain in holiday mood.

Gold trims intraday gains, approaches $4,300

Gold retreated sharply from the $4,400  area and trades flat for the day in the $4,320 price zone. Choppy trading conditions exacerbated the intraday decline, although XAU/USD bearish case is out of the picture, considering growing expectations for a dovish Fed and persistent geopolitical tensions.

Cardano gains early New Year momentum, bulls target falling wedge breakout

Cardano kicks off the New Year on a positive note and is extending gains, trading above $0.36 at the time of writing on Friday. Improving on-chain and derivatives data point to growing bullish interest, while the technical outlook keeps an upside breakout in focus.

Economic outlook 2026-2027 in advanced countries: Solidity test

After a year marked by global economic resilience and ending on a note of optimism, 2026 looks promising and could be a year of solid economic performance. In our baseline scenario, we expect most of the supportive factors at work in 2025 to continue to play a role in 2026.

Crypto market outlook for 2026

Year 2025 was volatile, as crypto often is.  Among positive catalysts were favourable regulatory changes in the U.S., rise of Digital Asset Treasuries (DAT), adoption of AI and tokenization of Real-World-Assets (RWA).