|

Intraday Elliott Wave view favors more downside in USD/JPY [Video]

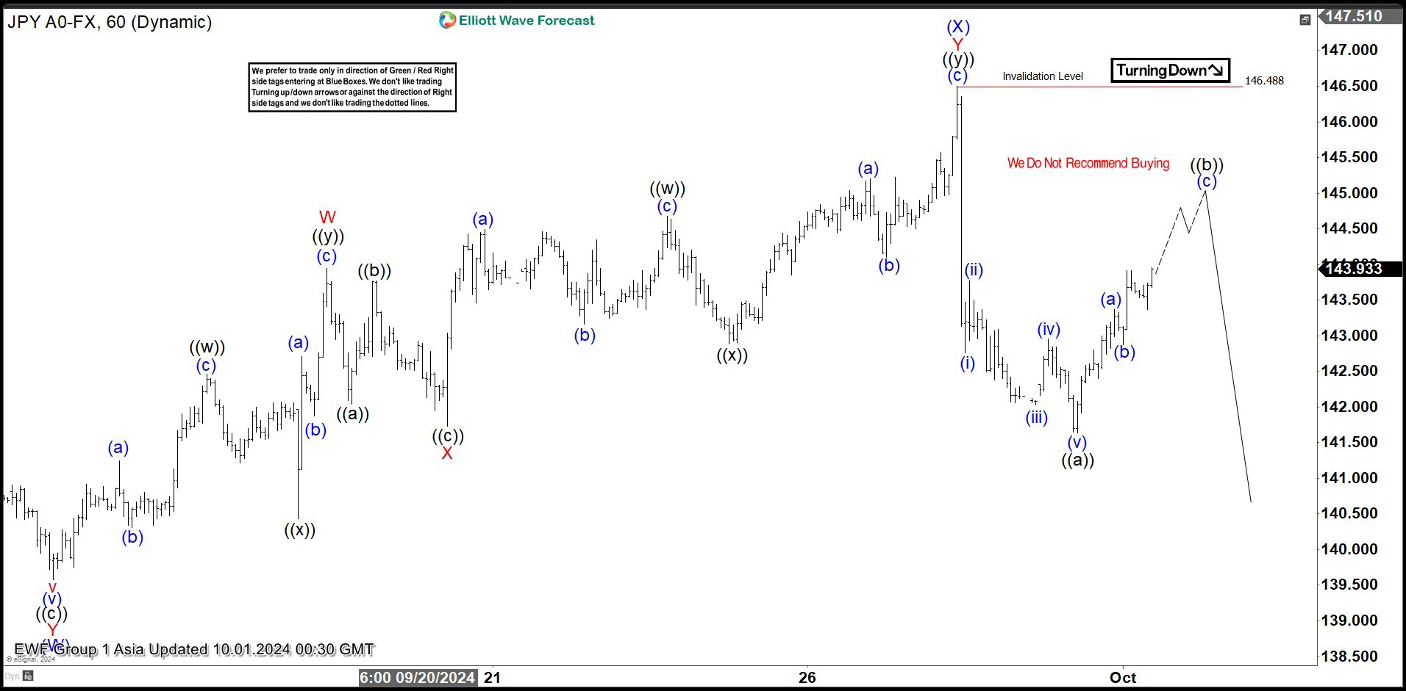
Short term Elliott Wave View in USD/JPY suggests decline to 139.57 ended wave (W). Pair then corrected in wave (X) with internal subdivision as a double three Elliott Wave structure. Up from wave (W), wave ((w)) ended at 142.46 and pullback in wave ((x)) ended at 140.43. Rally in wave ((y)) ended at 143.94 which completed wave W in higher degree. Pullback in wave X ended at 141.73 with internal subdivision as a zigzag structure.

Up from wave X, pair resumed higher in wave ((w)) towards 144.68 and pullback in wave ((x)) ended at 142.88. Final leg wave ((y)) ended at 146.48 which completed wave Y of (X) in higher degree. Pair has since turned lower in wave (Y). Down from wave (X), wave (i) ended at 142.76 and wave (ii) ended at 143.76. Wave (iii) lower ended at 142.2, and wave (iv) ended at 142.95. Wave (v) lower ended at 141.63 which completed wave ((a)) in higher degree.  Rally in wave ((b)) is in progress to correct cycle from 9.27.2024 high before it resumes lower. Near term, as far as pivot at 146.48 high stays intact, expect rally to fail in 3, 7, or 11 swing for more downside.

USD/JPY 60 minutes Elliott Wave chart

USD/JPY Elliott Wave [Video]

Author

Elliott Wave Forecast Team

Elliott Wave Forecast Team

ElliottWave-Forecast.com

More from Elliott Wave Forecast Team
Share:

Editor's Picks

EUR/USD tests nine-day EMA support near 1.1850

EUR/USD inches lower during the Asian hours on Monday, trading around 1.1870 at the time of writing. The 14-day Relative Strength Index momentum indicator at 56 stays above the midline, confirming improving momentum. RSI has cooled from prior overbought readings but stabilizes above 50, suggesting dips could stay limited before buyers reassert control.

GBP/USD flat lines as traders await key UK macro data and FOMC minutes

The GBP/USD pair kicks off a new week on a subdued note and oscillates in a narrow range, just below mid-1.3600s, during the Asian session. Moreover, the mixed fundamental backdrop warrants some caution for aggressive traders as the market focus now shifts to this week's important releases from the UK and the US.

Gold buyers hesitate amid holiday-thinned trading

Gold trades volatile, but within range, as US, China holidays-led thin trading exaggerates moves. The US Dollar extends range play into the US GDP week, with markets pricing at least two Fed rate cuts this year. Technically, Gold tests key support at $5,000; daily RSI still remains bullish.

Top Crypto Losers: Dogecoin, Zcash, Bonk – Meme and Privacy coins under pressure

Meme coins such as Dogecoin and Bonk, alongside the privacy coin Zcash (ZEC), are leading the broader market losses over the last 24 hours. DOGE, ZEC, and BONK ended their three consecutive days of recovery with a sudden decline on Sunday, as crucial resistance levels capped the gains. Technically, the altcoins show downside risk, starting the week under pressure.

Global inflation watch: Signs of cooling services inflation

Realized inflation landed close to expectations in January, as negative base effects weighed on the annual rates. Remaining sticky inflation is largely explained by services, while tariff-driven goods inflation remains limited even in the US.

Ripple Price Forecast: XRP potential bottom could be in sight

Ripple edges up above the intraday low of $1.35 at the time of writing on Friday amid mixed price actions across the crypto market. The remittance token failed to hold support at $1.40 the previous day, reflecting risk-off sentiment amid a decline in retail and institutional sentiment.