Insights for the Asian trading session 11/9/2018

Insights for the Asian trading session 11/9/2018
* United Kingdom Manufacturing Production (YoY) (July) down by 1.1% from 1.5%
* United Kingdom Manufacturing Production (MoM) July down by -0.2% from 0.4%
* United Kingdom Industrial Production (YoY) down by 0.9% from 1.1%
* United Kingdom Industrial Production (MoM) down by 0.1% from 0.4%
* European Monetary Union Sentix Investor Confidence down by 12 from 14.7
* United States Consumer Credit Change up by $16.64B from $8.46B
Tuesday's macro summary:
* The People's Bank of China (PBC) New Loans
* Australia National Australia Bank's Business Conditions
* Australia National Australia Bank's Business Confidence
* China FDI - Foreign Direct Investment (YTD) (YoY) (August)
* United Kingdom Average Earnings including Bonus (3Mo/Yr)
* United Kingdom ILO Unemployment Rate (3M)
* United Kingdom Claimant Count Unemployment Change
* United Kingdom Average Earnings excluding Bonus (3Mo/Yr)
* Germany ZEW Survey (Institutional Investor Sentiment) -Current Situation
* Germany ZEW Survey (institutional investor sentiment)- Economic Sentiment
* Canada Housing Starts s.a (YoY)
The FX major's current trade positions and their futures forecast
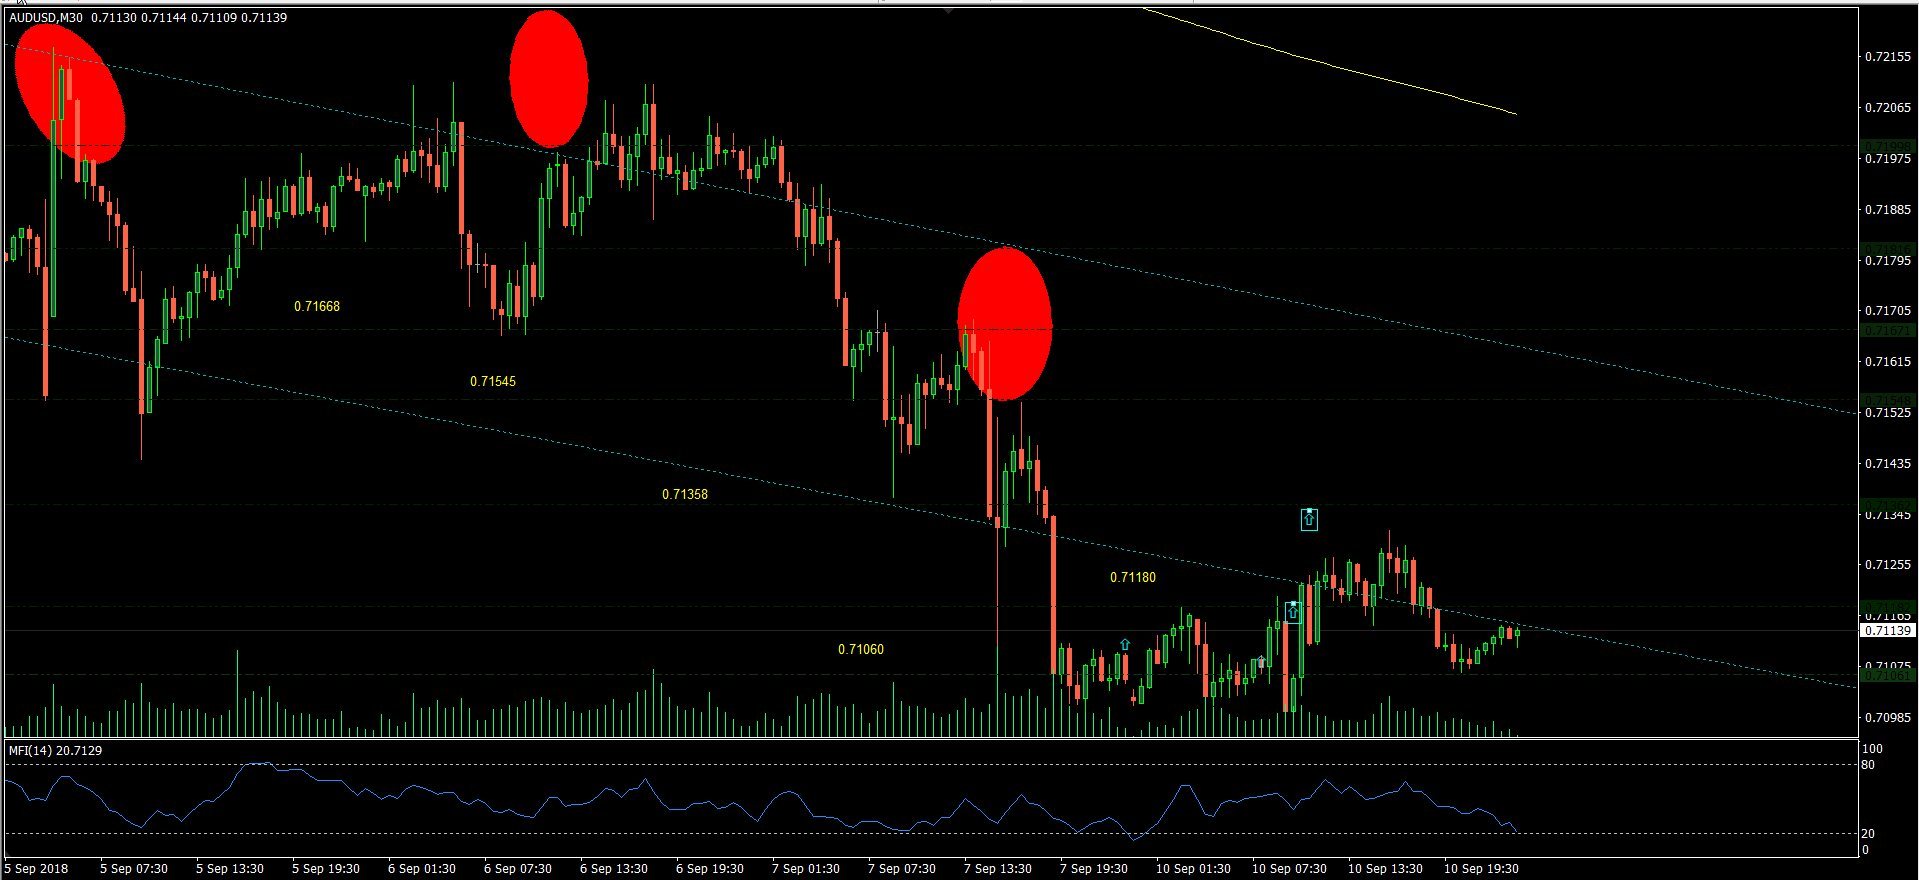
AUD/USD: The Australian dollar retreated from yesterday's highs at 0.7136 to 0.71060 support during the European session. The pair managed to bounce at 0.71060 support and now heads up towards the bottom of the price channel in the 30 minutes price chart. The pair could continue to retest its previous high if it makes into the price channel and also above 0.71180 resistance.
The short-term view of the AUD/USD price action in the 60 minutes price chart highlights the direction of the trend and the support and resistance price points
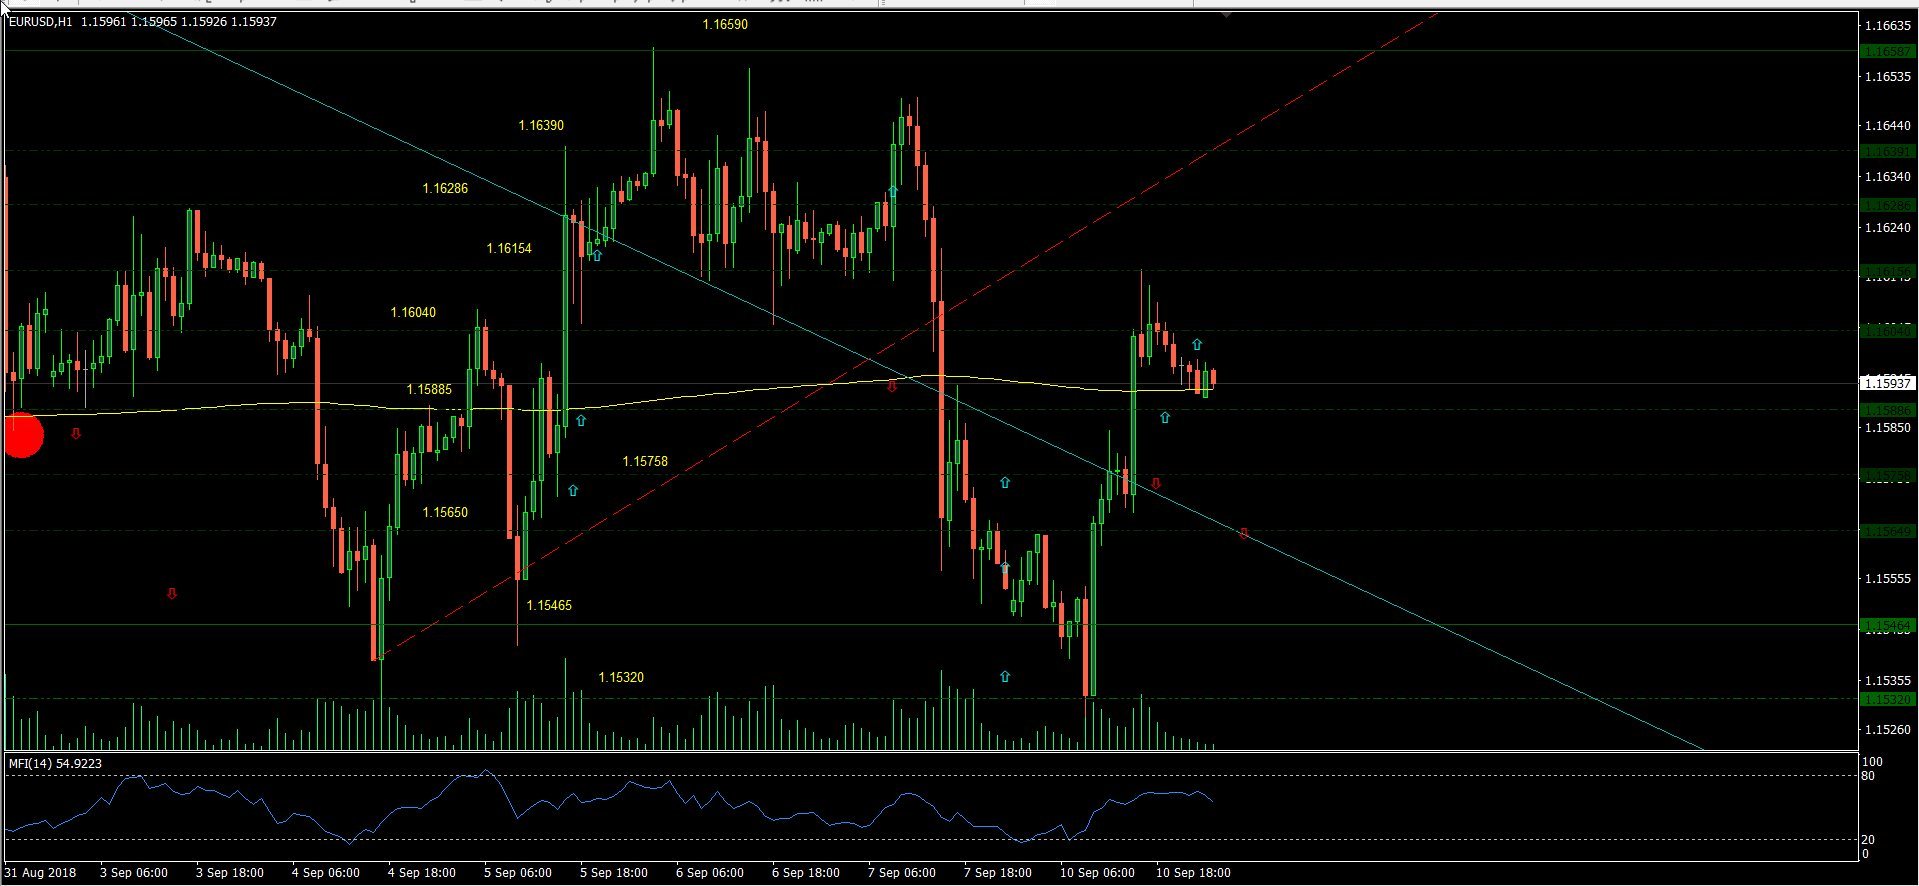
EUR/USD: The Euro retreated close to the estimated support price point indicated in yesterday's session at 1.15650. However, the pair headed straight back up and pierced through yesterday's target price at 1.5885 and its 500 EMA during the overnight session. The Euro hit its highest point of the session at 1.16154 before retreating to its 500 EMA. The pair currently trades at 1.15934 just above its 500 EMA in the 60 minutes price chart and could head back up to retest 1.6040 and 1.16154 if it continues to hold above its 500 EMA and 1.15885 support. The next support is estimated at 1.15758.
The short-term view of the EUR/USD price action in the 60 minutes price chart highlights the direction of the trend and the support and resistance price points
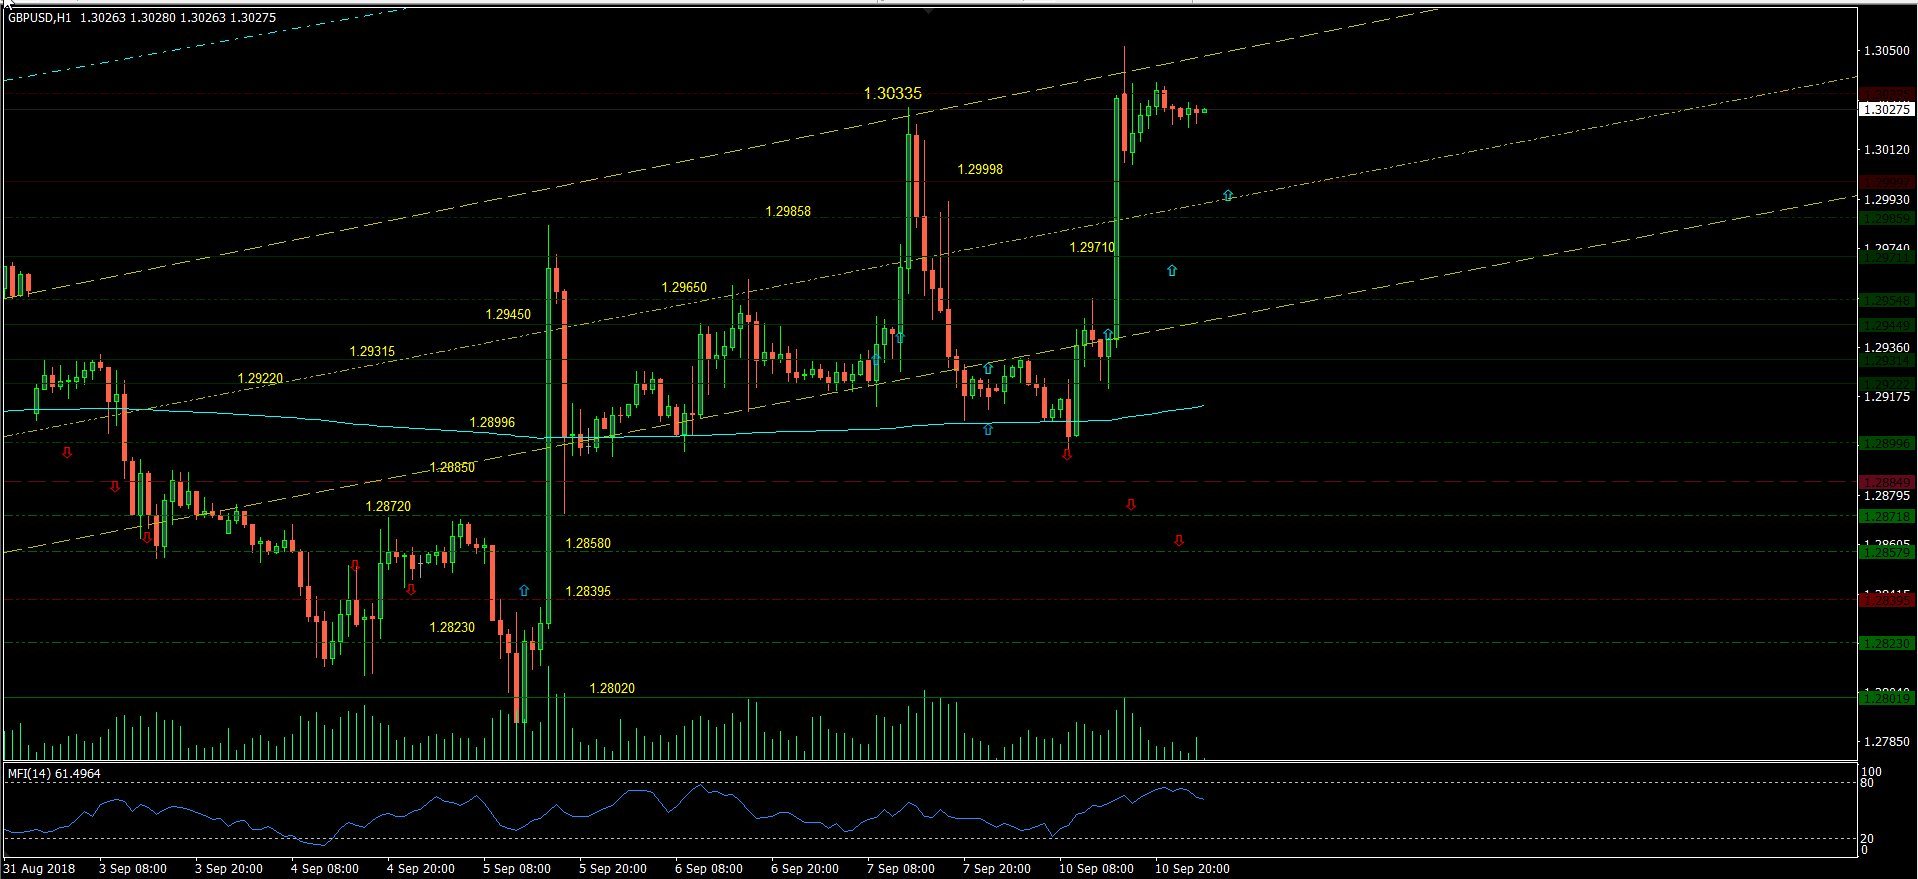
GBP/USD: The Pound retreated to the estimated support price level indicated in yesterday's session after taking out its first target at 1.29450. However, The poor Manufacturing Production and Industrial Production did not hinder the Pounds trading performance. The pair took off from 1.29450 support and reached all its estimated price target at 1.29710, 1.29778 and even 1.30335 at the top of the price channel. The pair currently trades at the top of the price channel at 1.30277 and looks a bit exhausted. It might retreat to 1.29888 support at the middle of the price channel before making its next move.
The short-term view of the GBP/USD price action in the 60 minutes price chart highlights the direction of the trend and the support and resistance price points
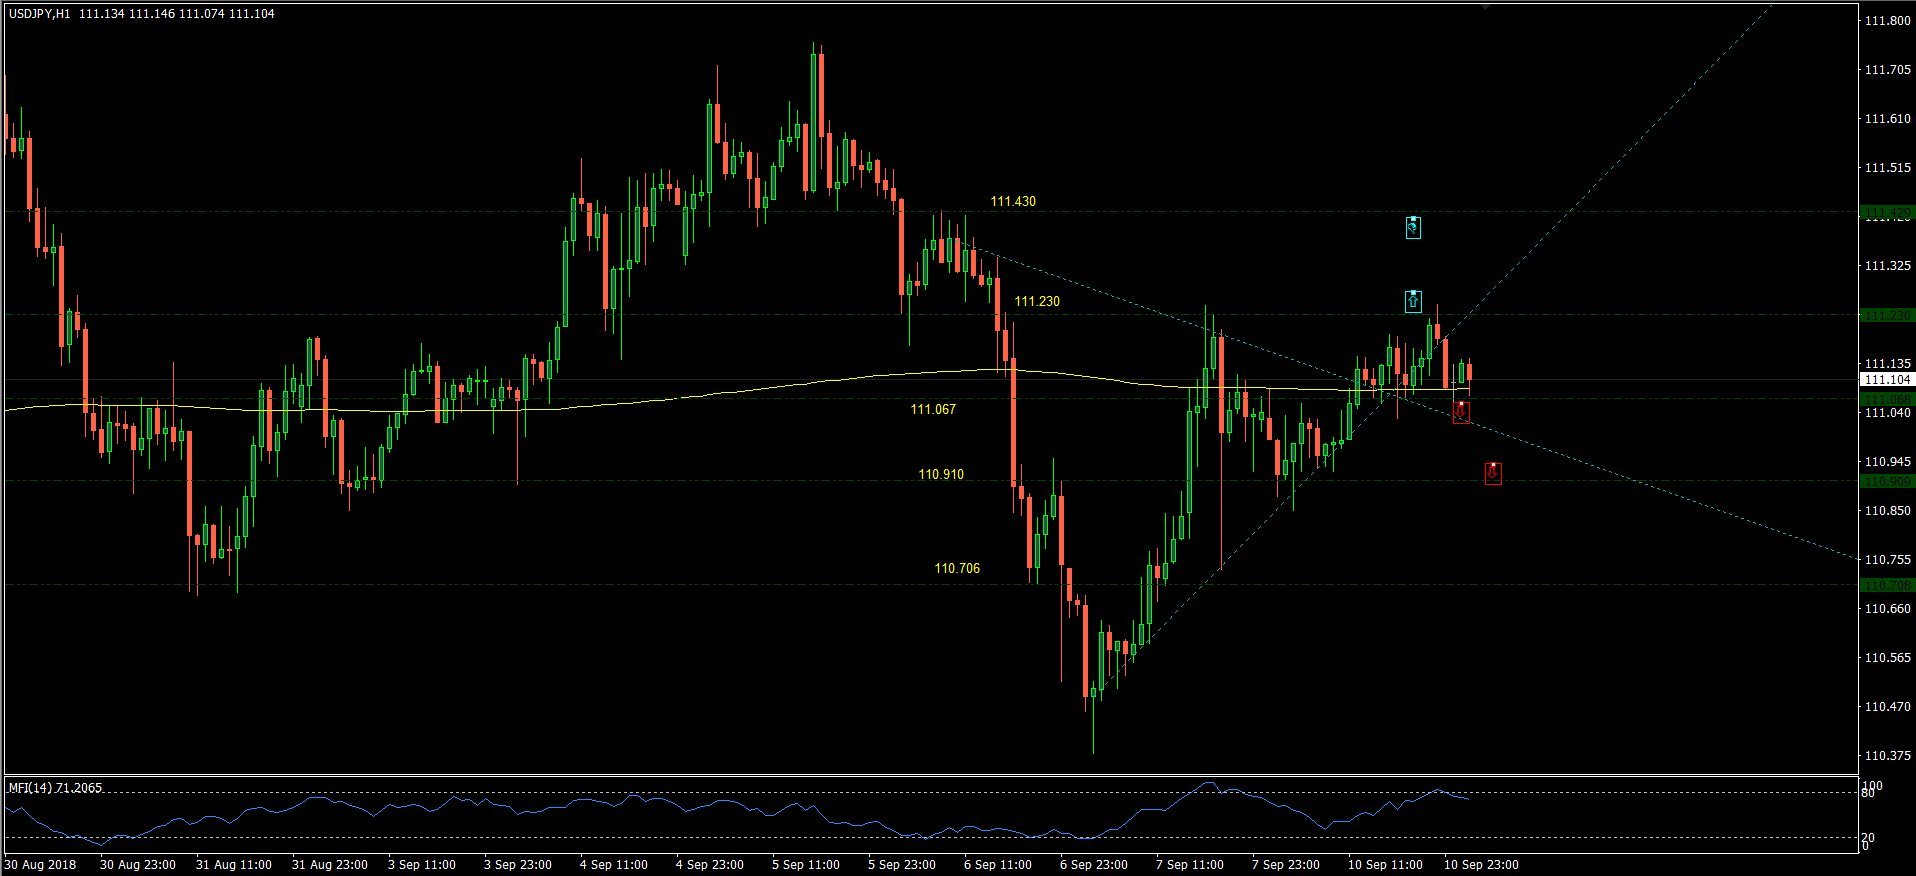
USD/JPY: The US dollar retreated to its 500 EMA in the 60 minutes price chart as indicated in yesterday's update. The pair bounced at its 500 EMA and retested its price target at 111.230 price point; however, it failed to continue and retreated again to its 500 EMA. The US dollar currently trades at 111.090 just above its 500 EMA in the 60 minutes price chart. The pair seems to be consolidating at 111.230 and its 500 EMA at 111.067, and it's going to continue until it breaks out. A break out above 111.230 could see the pair head up towards 111.430 price target and below 111.067 could push the pair down to 111.090.
The short-term view of the USD/JPY price action in the 60 minutes price chart highlights the direction of the trend and the support and resistance price points
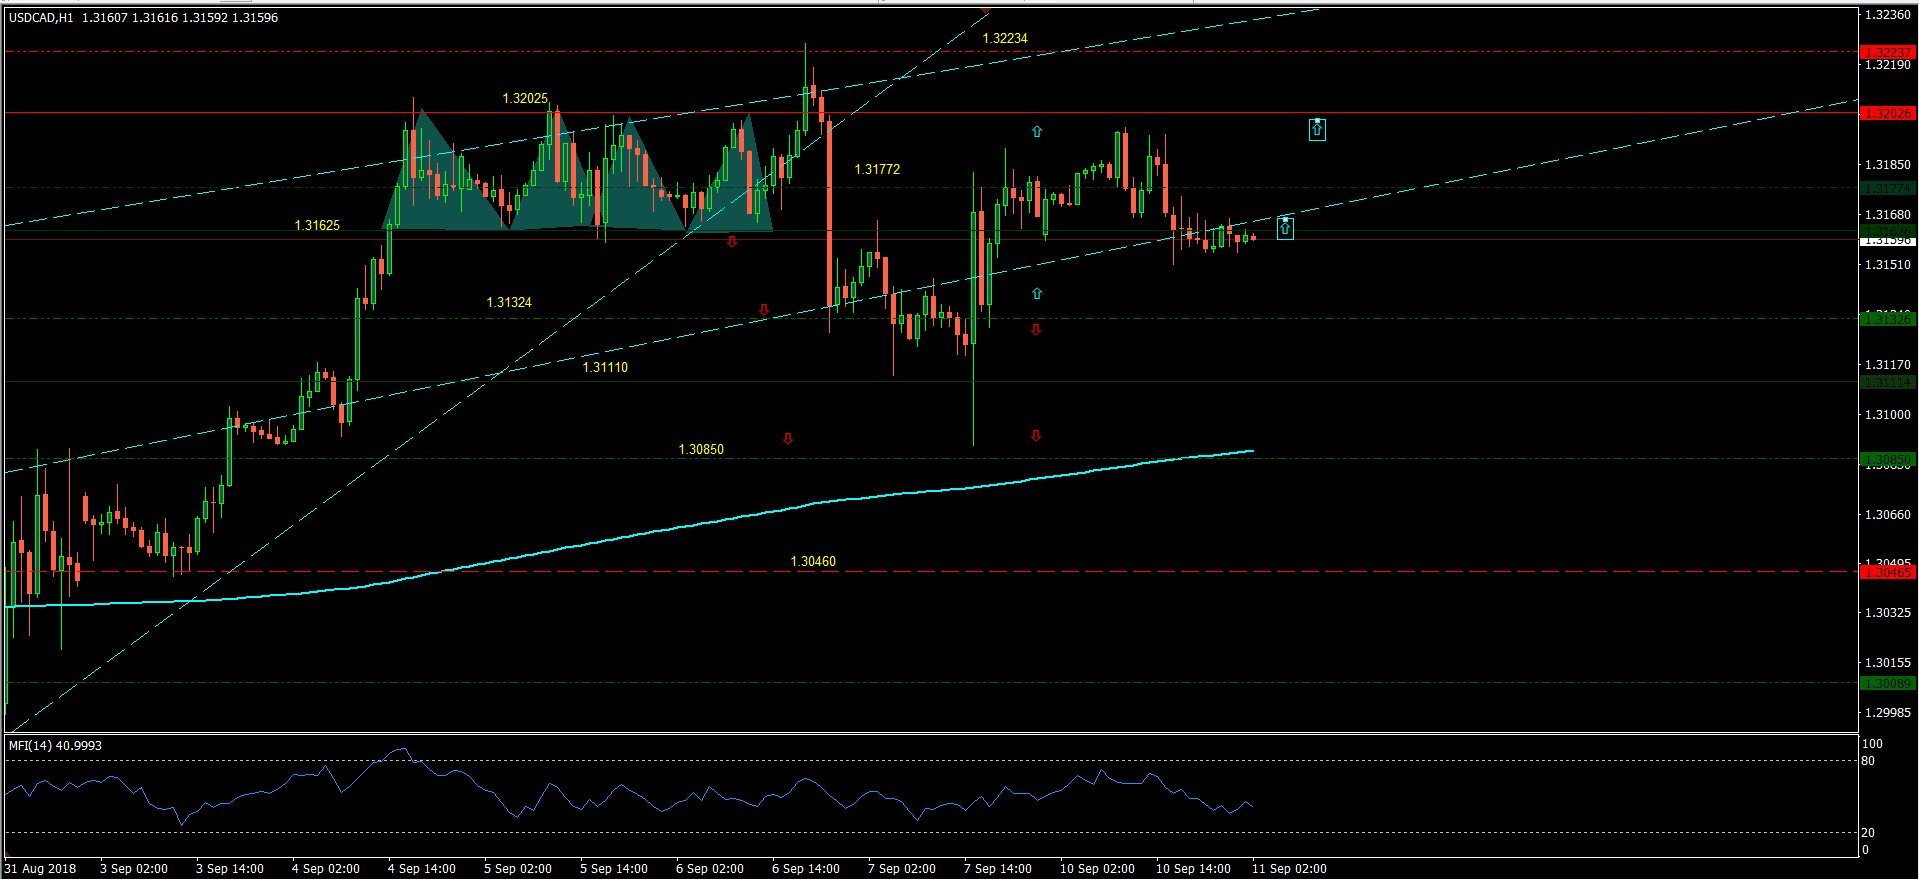
USD/CAD: The pair retreated from 1.39148 in the middle of the upward trend price channel in the 60 minutes price chart during the European trading session and now sits at the bottom of the price channel at 1.31625. The pair could fall to its next support at 1.31324 if it fails to stay above 1.31625. The US dollar needs to maintain its activities above 1.31625 to continue to its next price target at 1.32025.
The short-term view of the USD/CAD price action in the 60 minutes price chart highlights the direction of the trend and the support and resistance price points
Author

Denis Joeli Fatiaki
Independent Analyst
Denis Joeli Fatiaki possesses over a decade of extensive experience as a multi-asset trader and Market Strategist.


