Inflation and S&P 500 record highs – PPI, FOMC meeting in focus

Everyone (and I mean everyone) has been talking about inflation. We finally got the CPI print on Thursday: 0.6% vs. 0.4% expected! The S&P 500 didn’t seem to care, though. Record highs! What’s next?
Inflation is real, folks. Two monthly prints in a row now, with the most recent June print showing the largest increases in used cars/trucks, transportation services, fuel oil, and apparel. Initially, the CPI data release was sold in futures trading at 8:30 AM on Thursday, but price action quickly reversed to the upside. This price action stuck out to me. Markets do not always react as expected when data releases come out. In a bull market like this, sometimes the data doesn’t matter. This price action tells us a story.
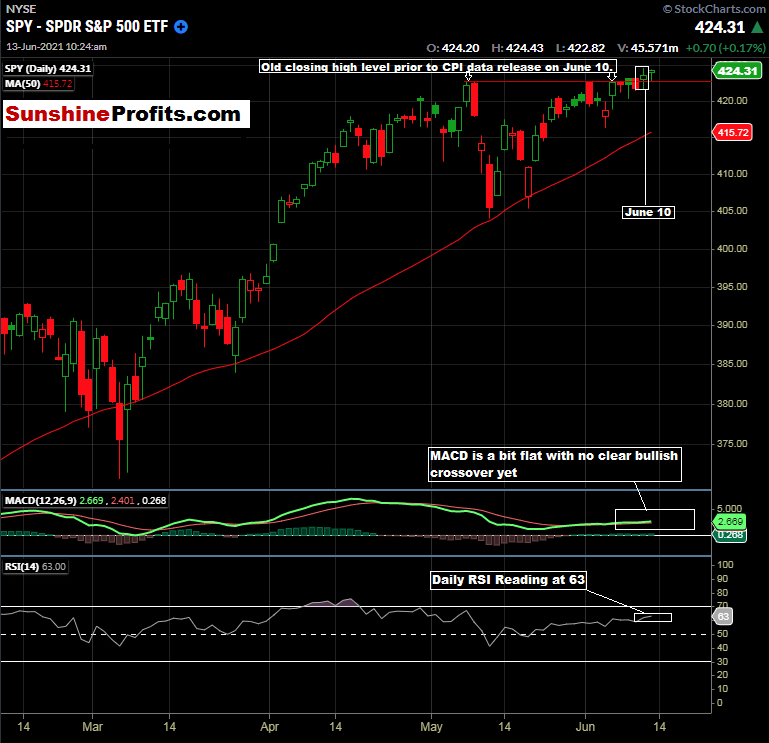
Figure 1 - SPDR S&P 500 ETF February 13, 2021, 8:45 PM - June 11, 2021, Daily Candles Source stockcharts.com
Notice the long “tail” or “wick” on the 8:30 AM candle above. The initial reaction was to sell the big CPI number, but it was quickly bought and ended up just being liquidity for the long/buy-side to gobble up and take the market higher. The retest that occurred hours later held up, and a new range was established for the remainder of the week.
The S&P 500 closed at an all-time closing high level on Friday
What can this tell us? This market wants to move higher. Perhaps the higher inflation trickles into stocks as well; if used trucks cost more, couldn’t shares of stocks cost more too? It is plausible and also somewhat concerning. Higher inflation should not be construed as a bullish event, but as we know, markets can remain irrational - and for extended periods.
Drilling down to the intraday candles, we can see the price action that occurred when the CPI data was released. The September S&P 500 Futures quickly moved lower on the release, but within minutes, snapped back and reversed to the upside. The price area was retested hours later (see below), and this area held up very well as support.
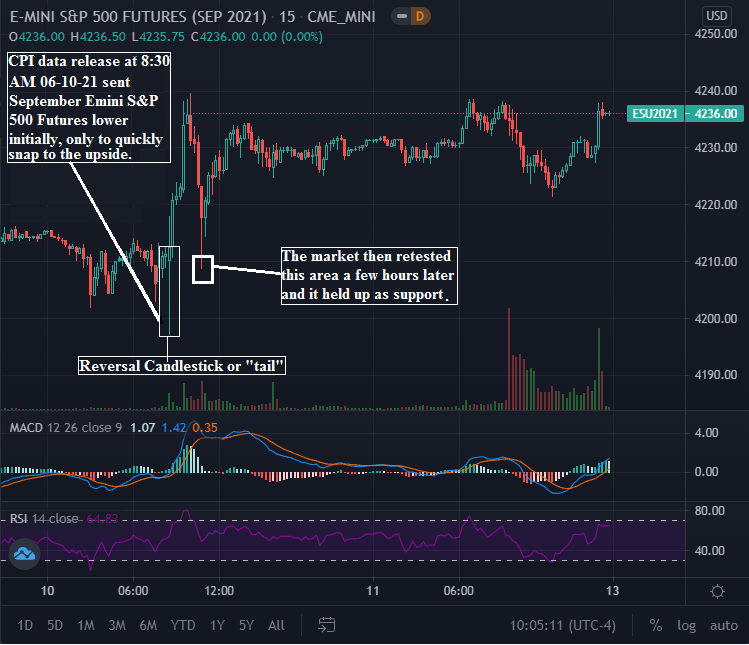
Figure 2 - September Emini S&P 500 Futures June 9, 2021, 8:45 PM - June 11, 2021, 15-minute Candles Source tradingview.com
So, we have a bit of a conundrum on our hands in the US equity indices, in my opinion. We have the S&P 500 closing at all-time highs on Friday. The breakout (if you want to call it that) is a bit anemic as of now, and the other major indices have yet to close at all-time highs.
The Week ahead
The major event this week: the FOMC meeting on June 15-16, with the Fed statement coming out on Wednesday at 2:00 PM ET. Prior to the Fed statement, we do have PPI and Retail Sales data coming out on Tuesday at 8:30 AM ET. The retail sales data will give us some additional insight into the US consumer, and the PPI is known to be a leading indicator of consumer inflation.
While Retail Sales and PPI could provide a spat of movement in the indices, I am expecting a quiet week leading up to the Fed decision on Wednesday afternoon. This type of quiet trade has been the prevailing theme lately; last week was quiet leading up to CPI, and the week prior was quiet leading up to Non-Farm Payrolls. Both of those numbers were anything but bullish by the way, but here we are at all-time highs in the S&P 500.
What is working
While a pullback in the S&P 500 to the 50-day moving average would catch my attention for a potential long entry, there seem to be better places to focus on at this moment. The US infrastructure plays have been playing out well, even with the back and forth negotiations by the two parties.
ERTH Invesco MSCI Sustainable Future ETF has been working well since we identified it for a long entry near its 200-day moving average in our May 10th publication, and it is still in the middle of its 2021 range.
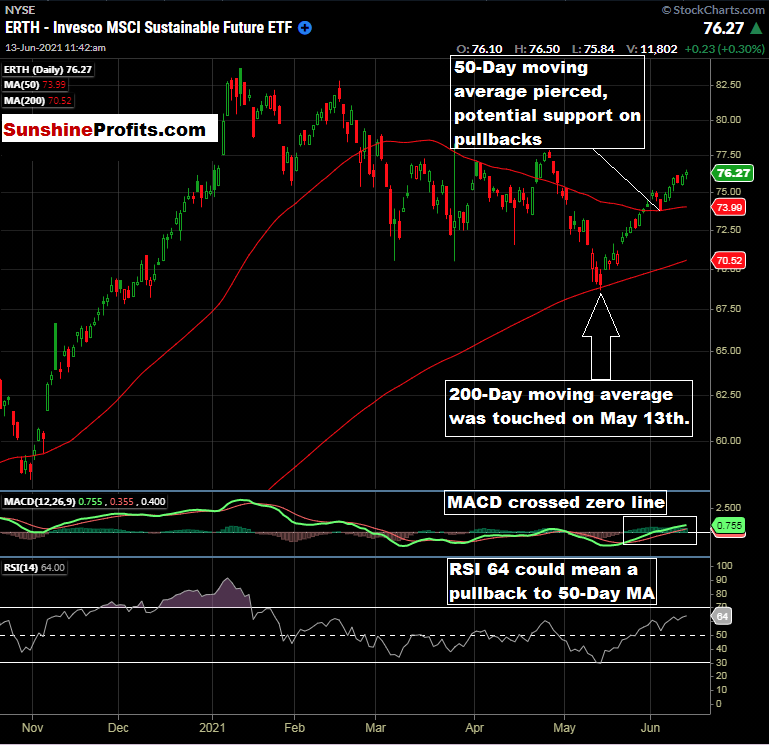
Figure 3 - Invesco MSCI Sustainable Future ETF (ERTH) Daily Candles October 21, 2020 - June 11, 2021. Source stockcharts.com
Want free follow-ups to the above article and details not available to 99%+ investors? Sign up to our free newsletter today!
Author

Rafael Zorabedian
Sunshine Profits
After spending years as an active trader across several capital markets, Rafael earned his stripes as a former futures and options broker specializing in equity indices, energies, metals, and soft commodities.


