Important change in US stocks, T-bonds and US dollar trends: What's next?

1/19 Recap - The S&P opened with a 11 handle gap up and then traded another 22 handles higher into a 9:58 AM high of the day. From that high, the S&P declined 48 handles into an 11:25 AM low. From that low, the S&P rallied 35 handles into a 12:30 PM high. From that high, the S&P declined 39 handles into a 2:33 PM low. From that low, the S&P zig zagged 18 handles higher into a 3:14 PM high. From that high, the S&P declined 46 handles into the close.
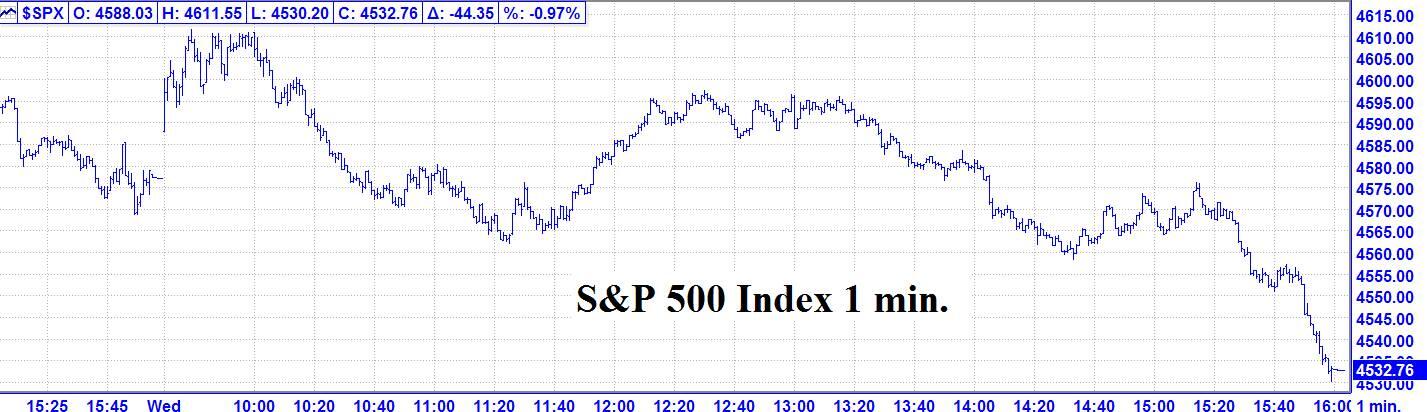
1/19 – The major indices, following a strong up opening, had a strong down day per the following closes: INDU - 339.82; S&P 500 - 44.35; and the NASDAQ Composite - 166.64.
Looking ahead - Wednesday was another strong down day. The S&P exceeded both our time and price parameters. I recommend standing aside now. The next change in trend window is due over the coming weekend.
The NOW Index is in the NEUTRAL ZONE.
Coming events
(Stocks potentially respond to all events).
B. 01/21 AC – Venus Perihelion. Major change in trend Cattle, Corn, Copper, Cotton, Gold, OJ, Sugar, and Wheat.
C. 01/25 AC – Jupiter 120 US Jupiter. Important change in trend US Stocks, T-Bonds, US Dollar.
D. 01/25 AC – Saturn 120 US Saturn. Important change in trend US Stocks, T-Bonds, US Dollar.
E. 01/28 AC – Venus in Capricorn goes Direct. Major change in trend Cattle, Coffee, Copper, Cotton, Sugar, & Wheat.
F. 01/28 AC – Jupiter 90 US Ascendant. Important change in trend US Stocks, T-Bonds, US Dollar.
Stock market key dates
Market math
DJIA* – 1/20, 1/24, 1/25-26, 1/28 AC.
S&P 500* - 1/19, 1/28 AC.
Fibonacci – 1/21, 1/25.
Astro – 1/24, 1/25-26, 1/28 AC.
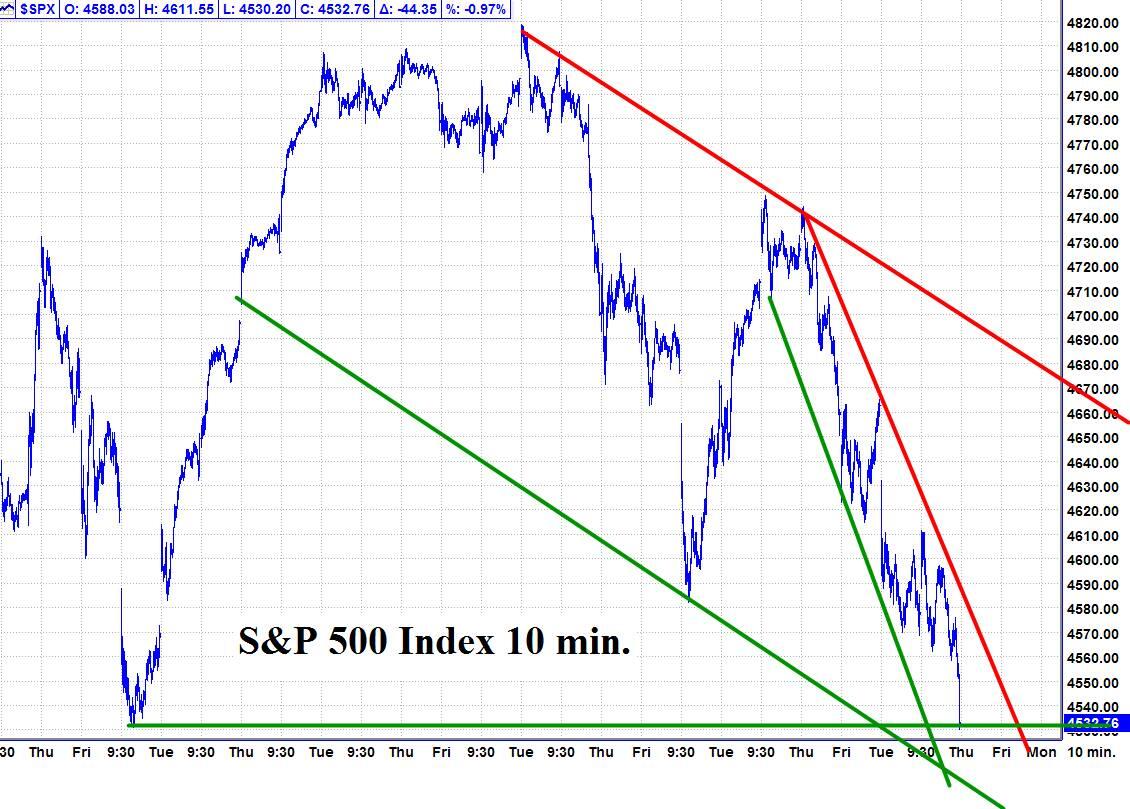
Please see below the S&P 500 10 minute chart.
Support - 4530 Resistance – 4580.
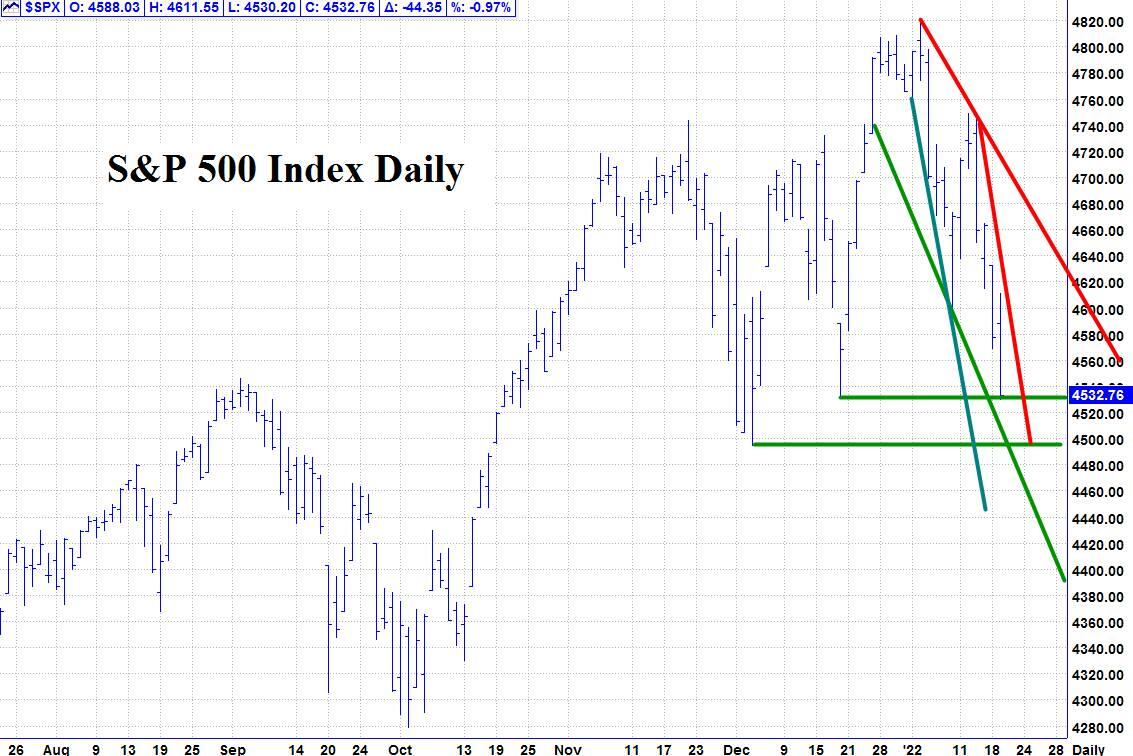
Please see below the S&P 500 Daily chart.
Support - 4530. 4500 Resistance – 4580.
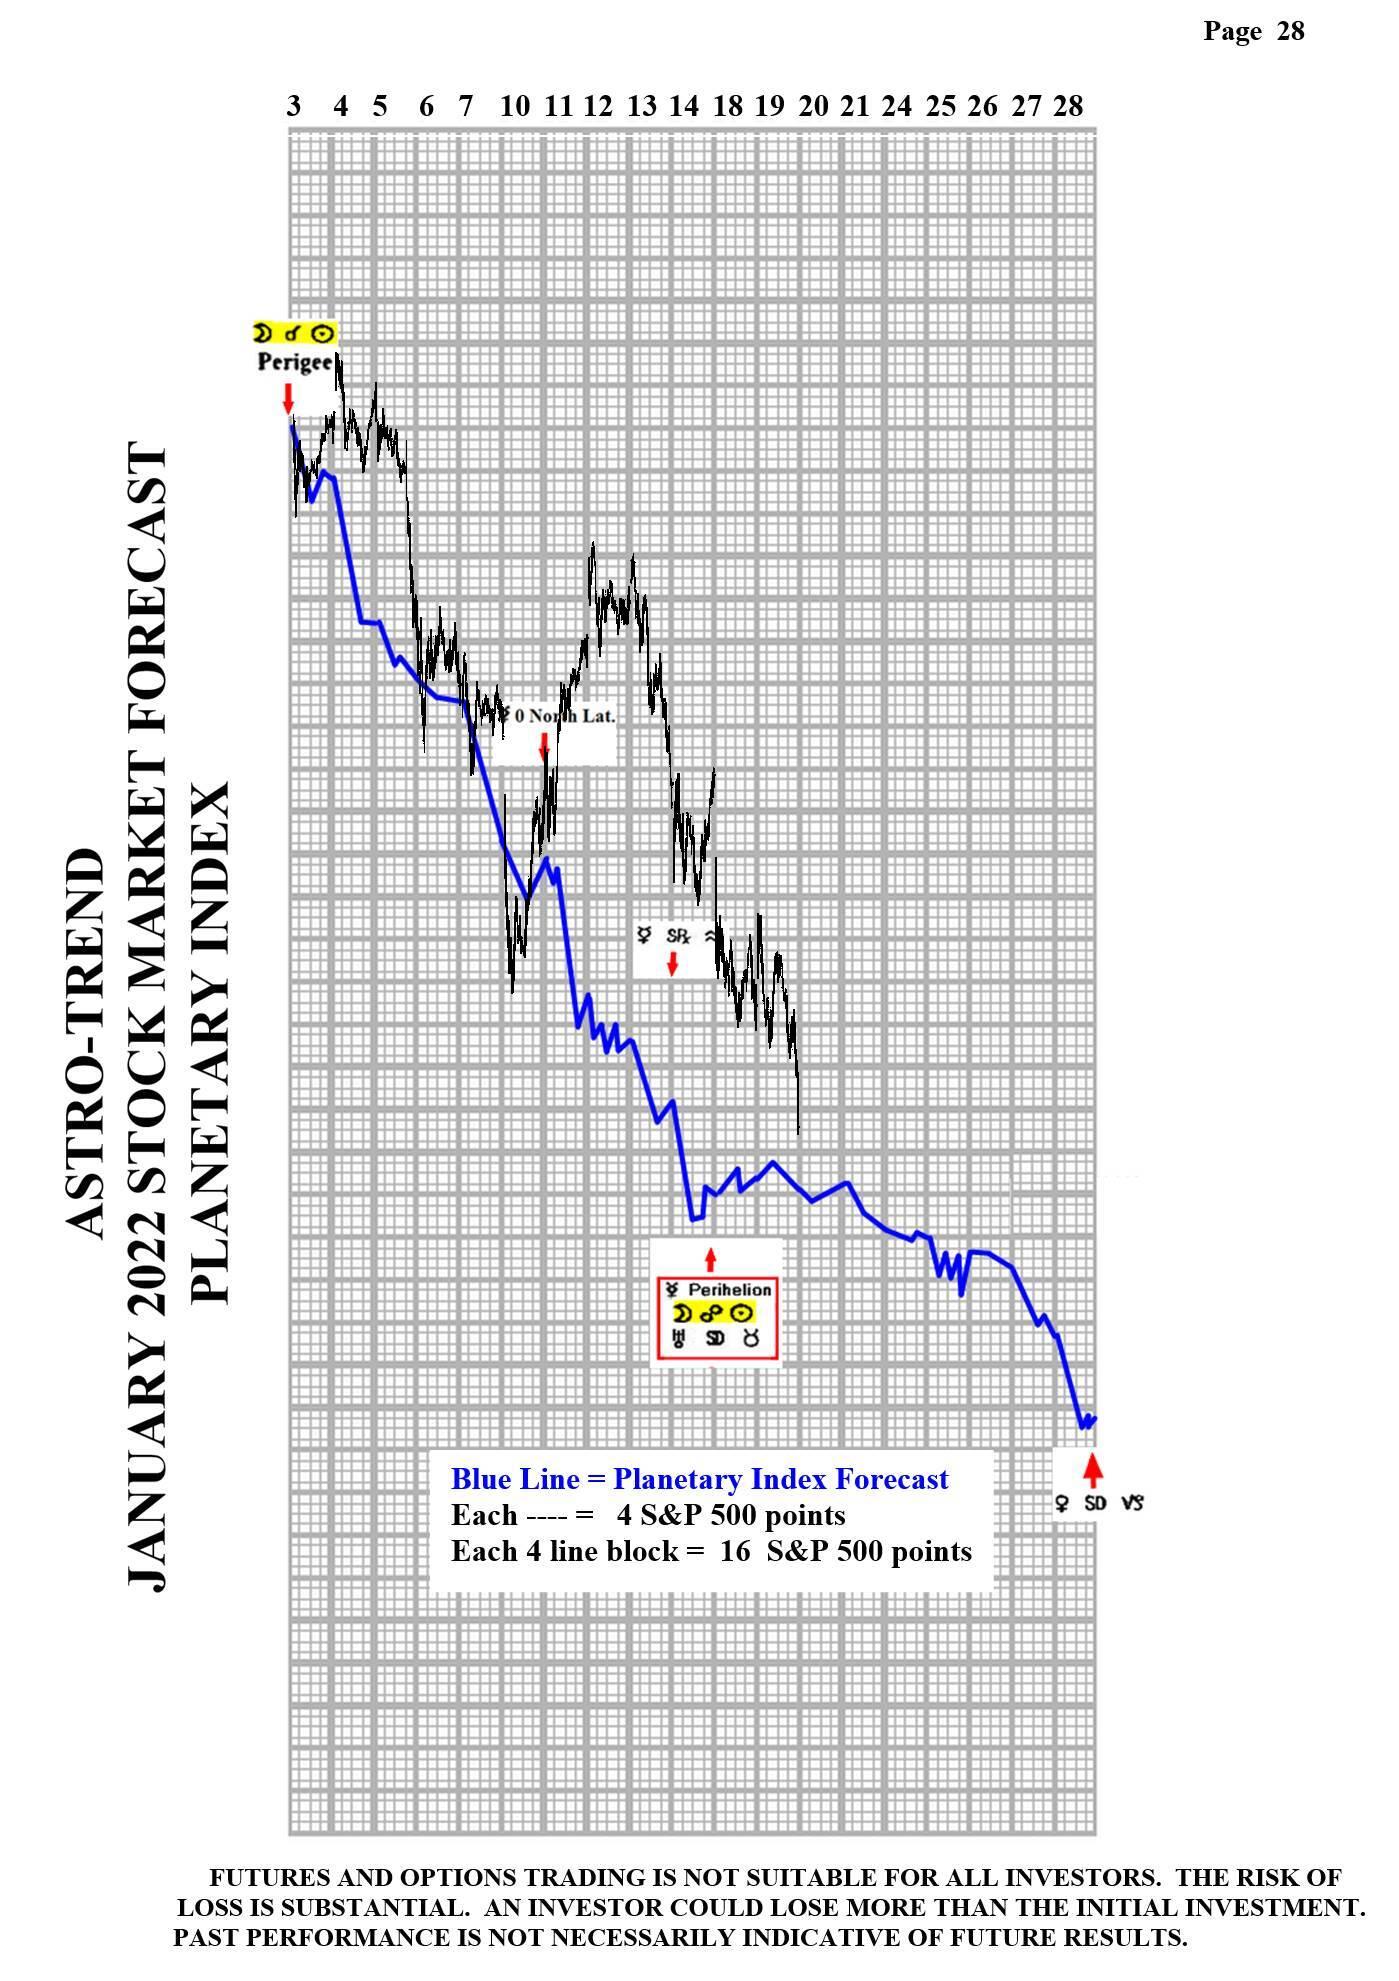
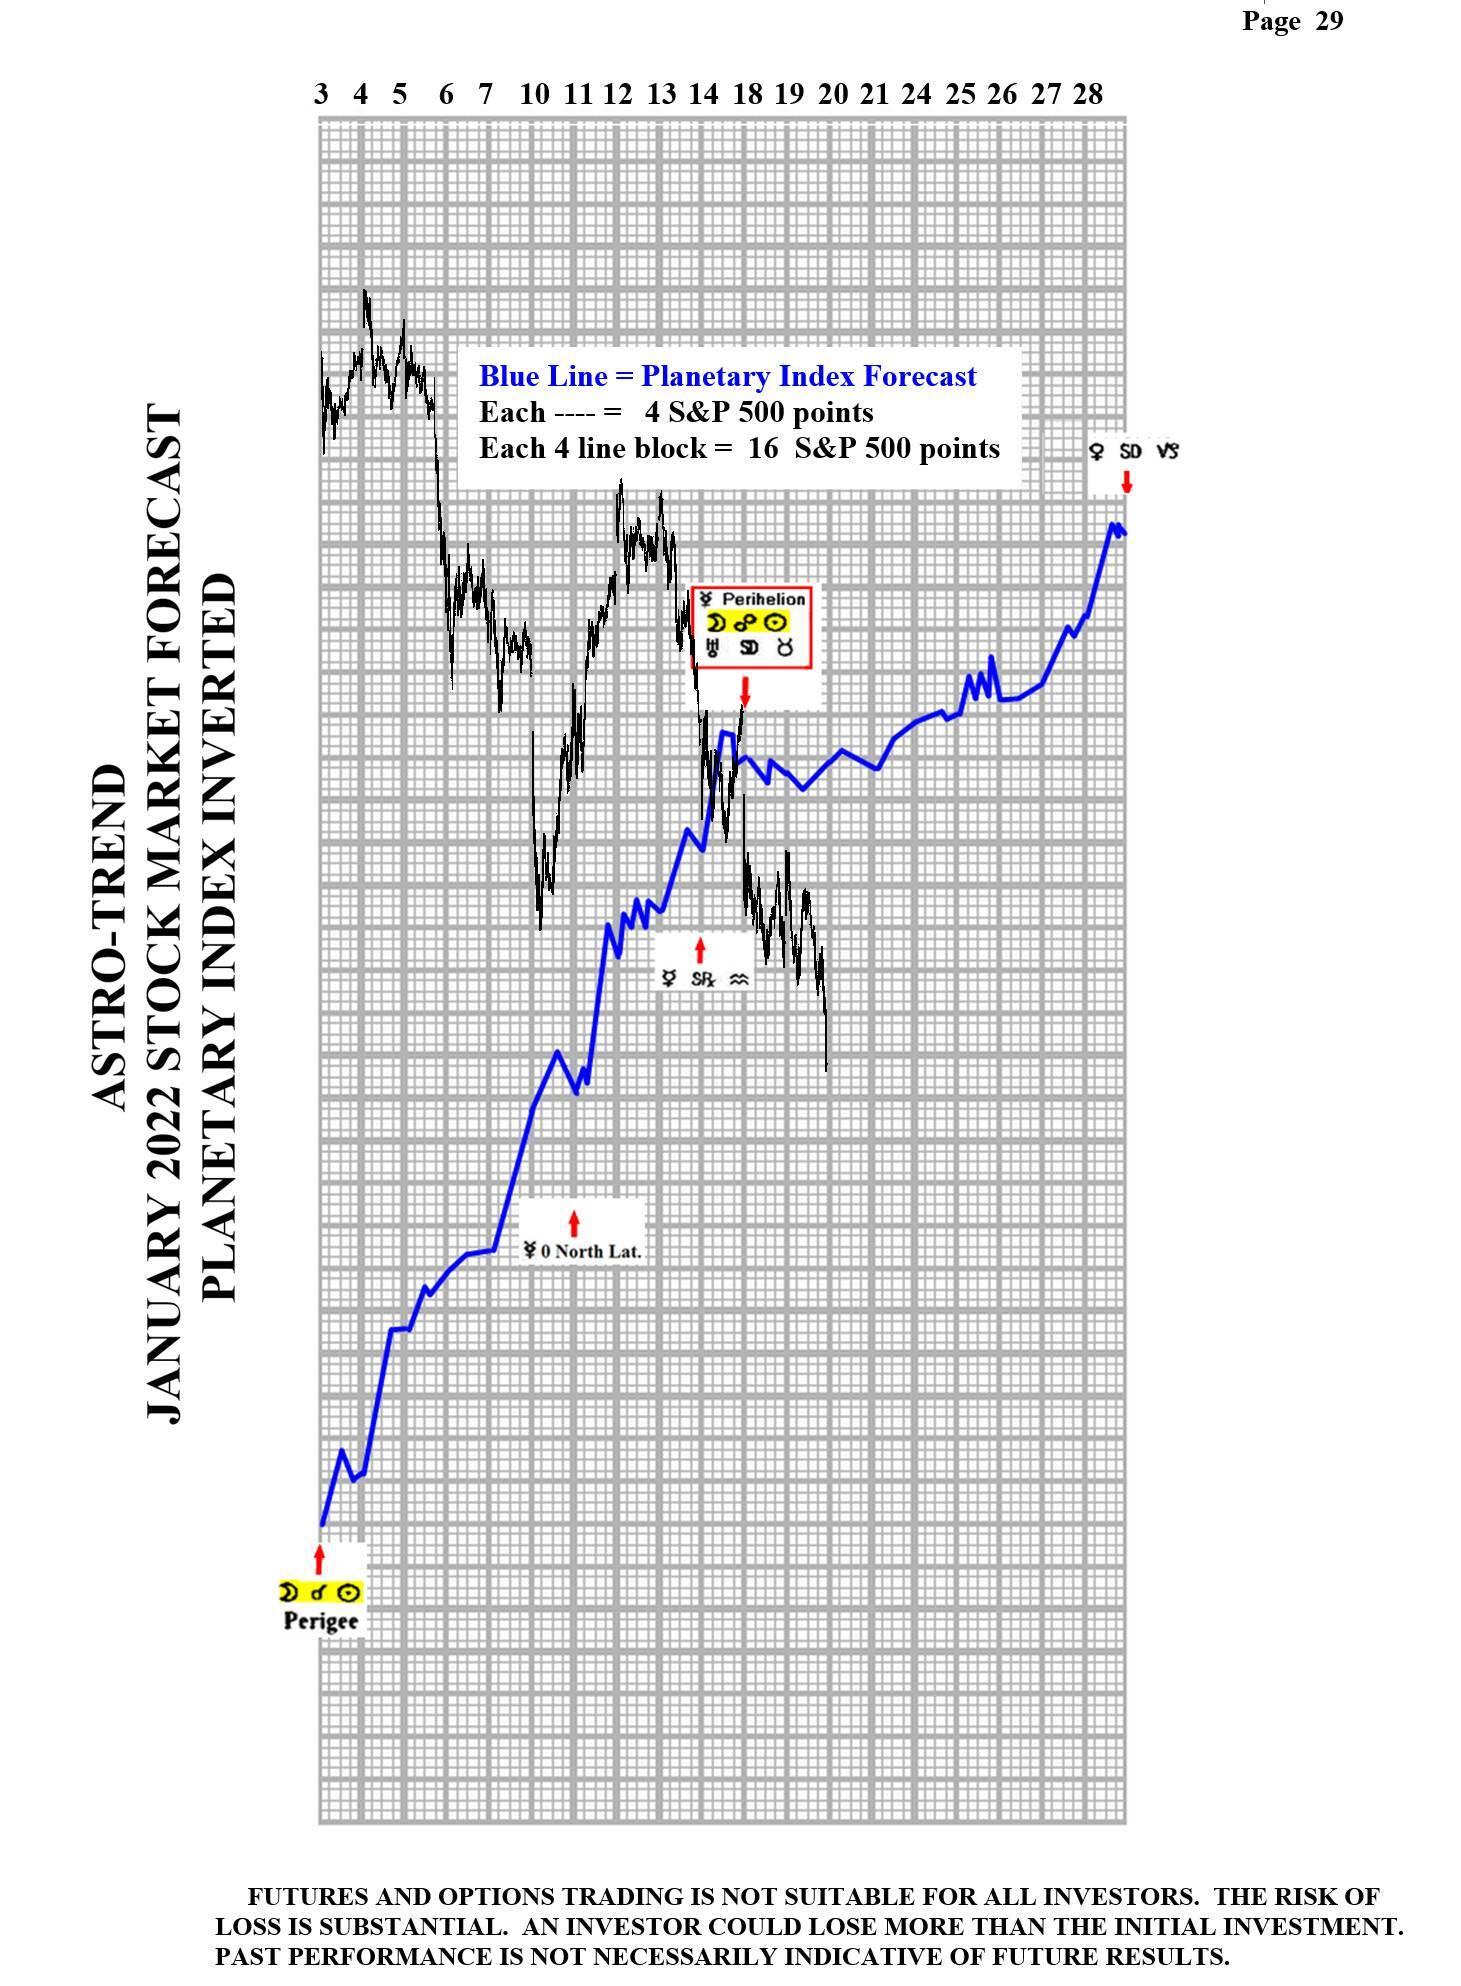
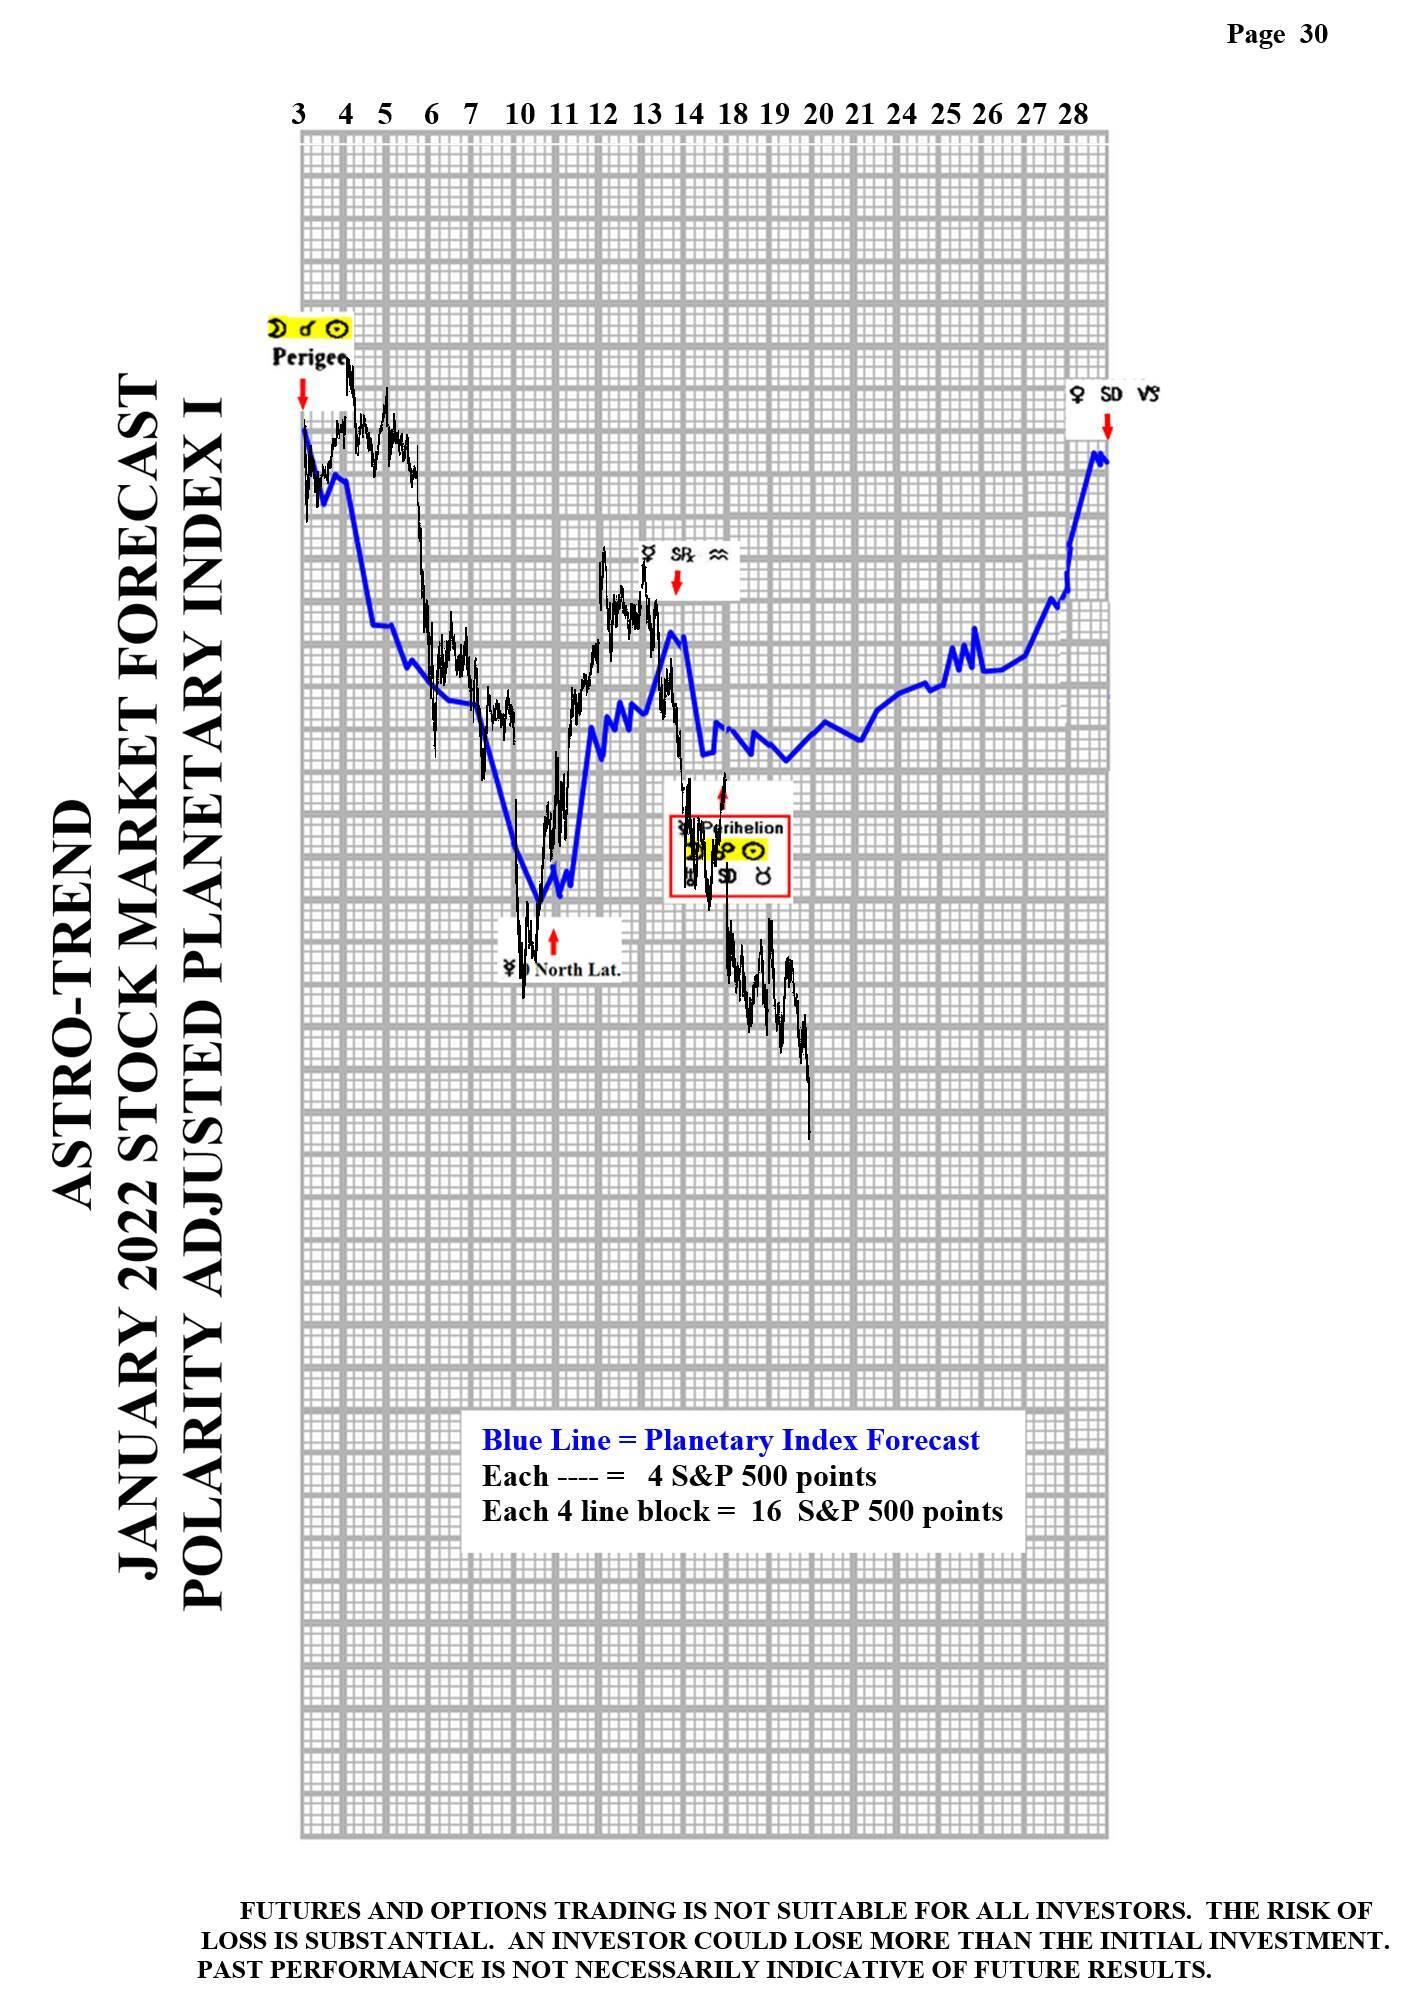
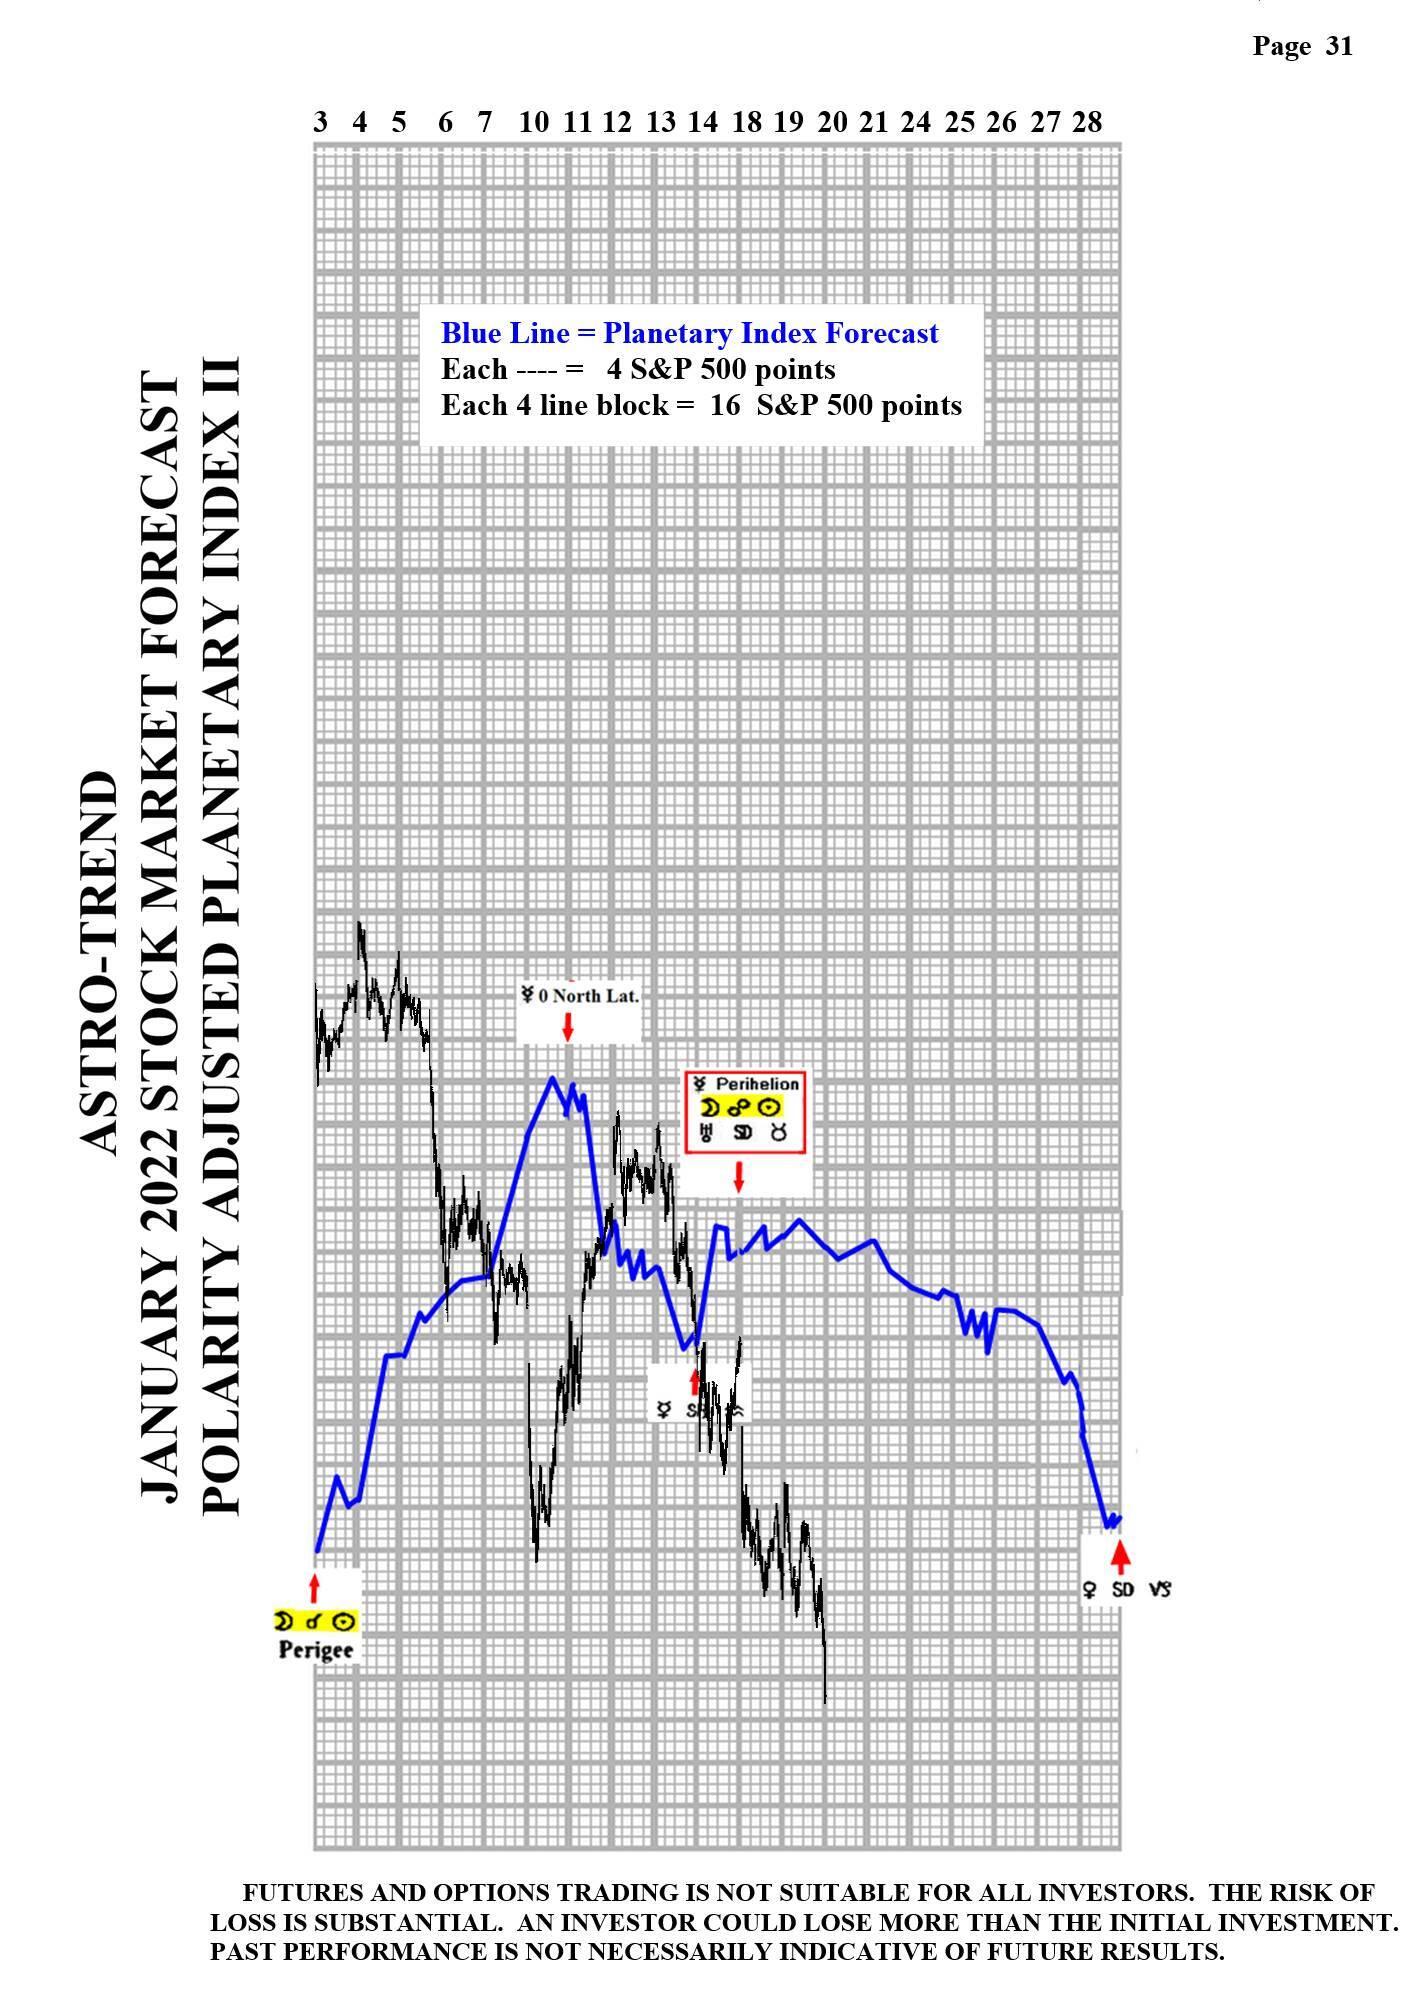
Please see below the January Planetary Index charts with S&P 500 10 minute bars for results.
Author

Norm Winski
Independent Analyst
www.astro-trend.com


