|

How to beat the S&P 500 with its own tools

S2N spotlight

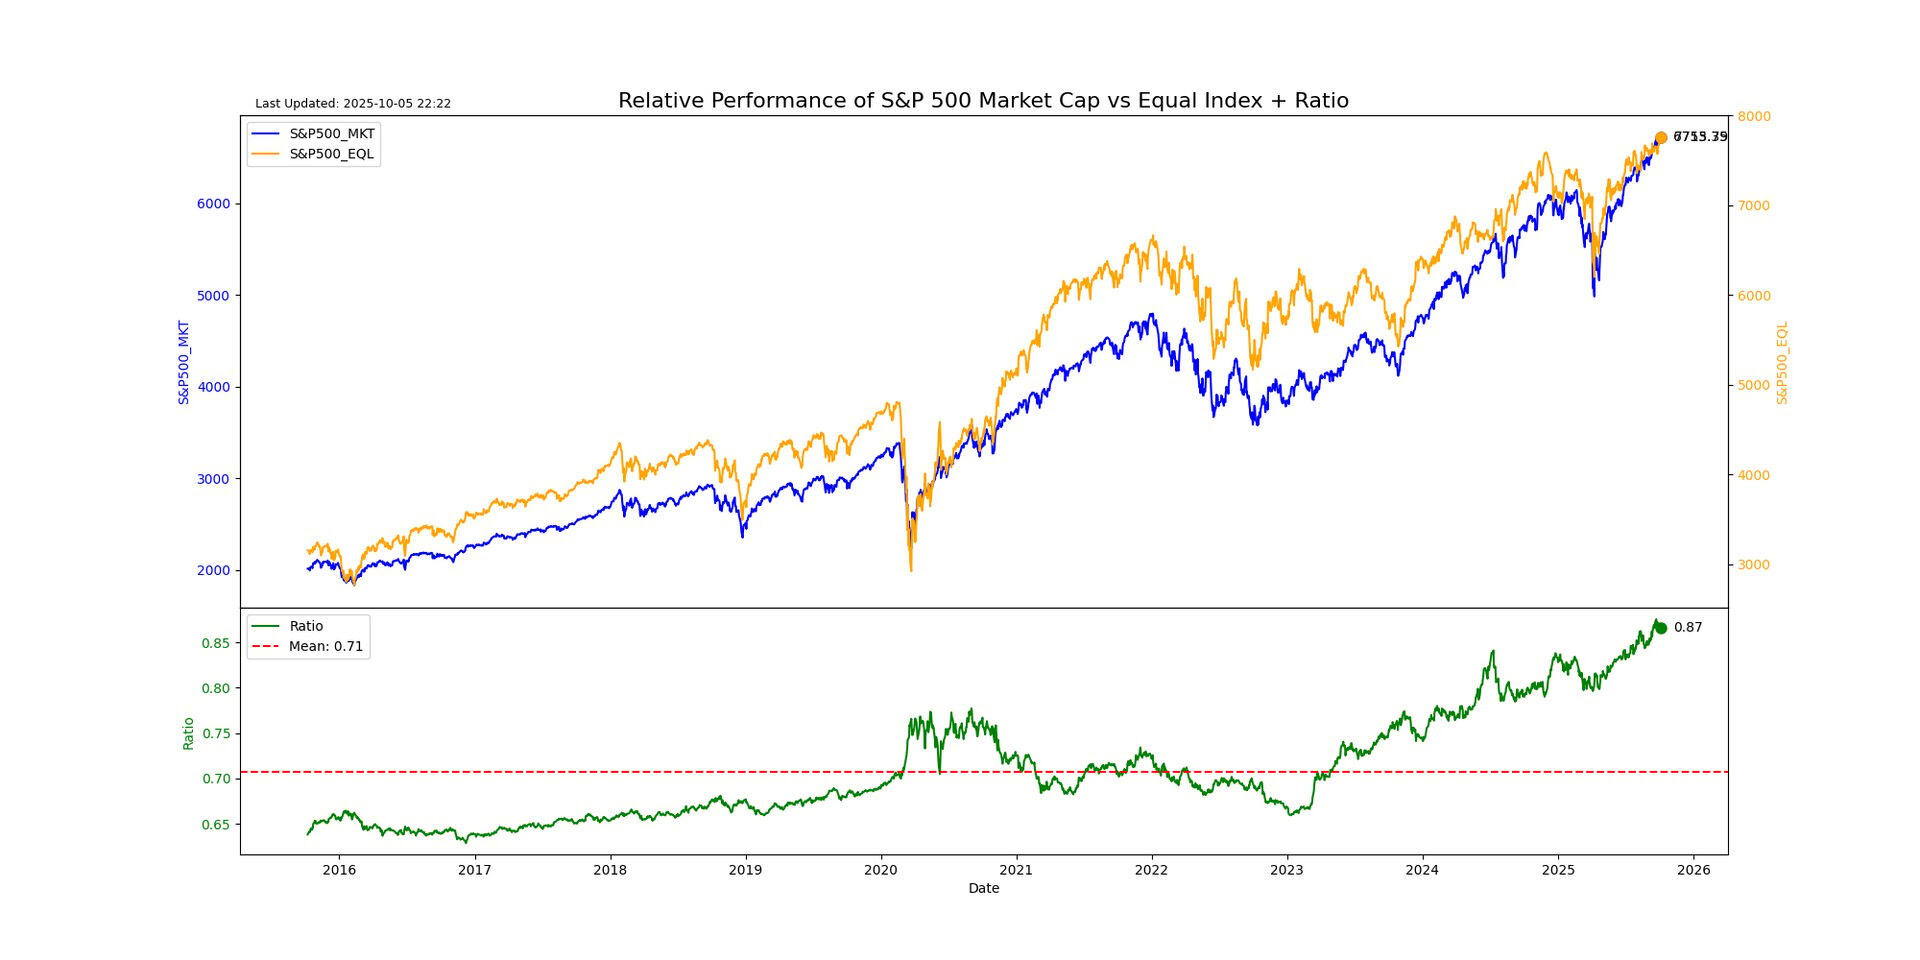
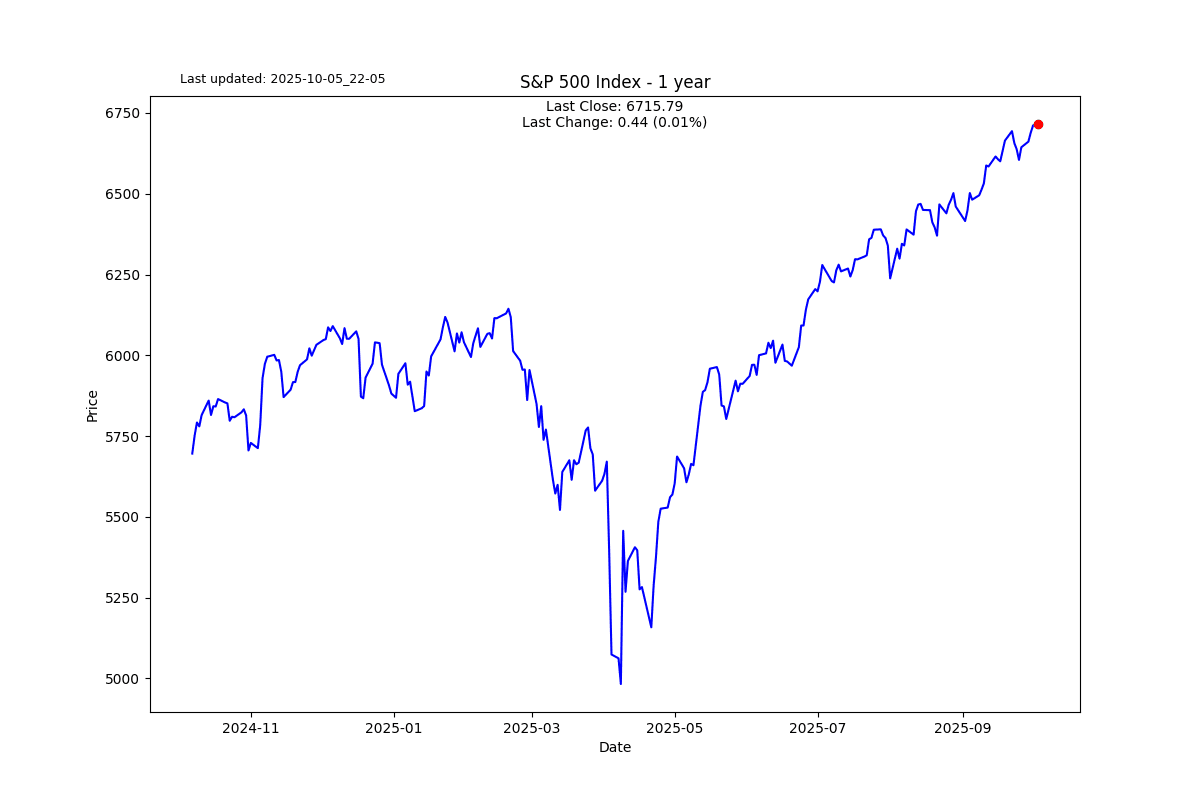
As we are constantly being told the bulk of the value of the S&P 500 market cap index, the one we are used to investing in, is dominated by a few technology heavyweight stocks. You can see by the green ratio button how the market cap index has accelerated relative to the equal weighted S&P 500 index.

If you are concerned that we may be in a bubble or even just overvalued territory, and you are not quite ready to commit to selling your equities or going short, then I would say the next best alternative is to switch from SPX (S&P 500 Market Cap) to SPXEW (S&P 500 Equal Weight).

Chart

S2N observations

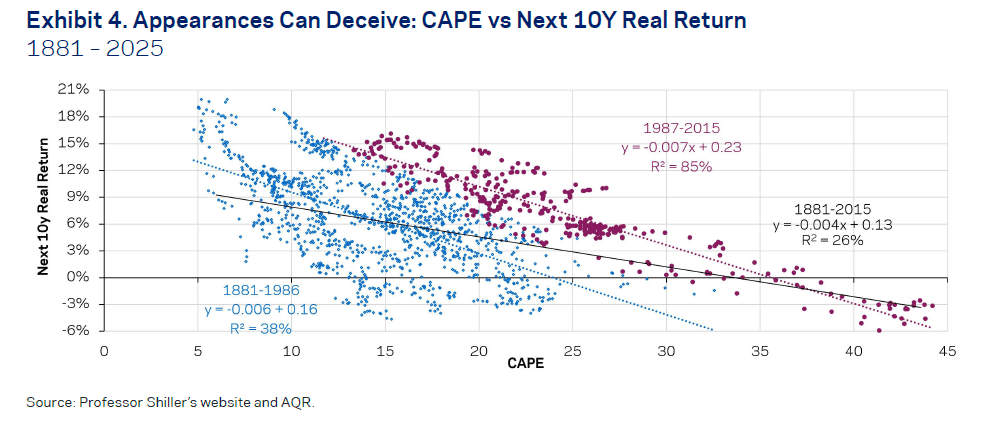
Really solid proof that the Shiller PE (or CAPE) i.e. 10 year trailing returns have a significant market timing effect on the next 10 years return in the markets.

From 1881-2025 you can see an r2 of 26% that is pretty significant. However, if you look at 1987-20215 with the violet colouring the r2 is 85% meaning that the PE ratio explains 86% of the future 10 years returns.

I have said it before and will say it again we are near record Shiller PE levels so the next 10 years are likely to be well below average. I know that is hard to accept given the strength of the current market, but there in lies the reason for the forecase.

Chart

S2N screener alert

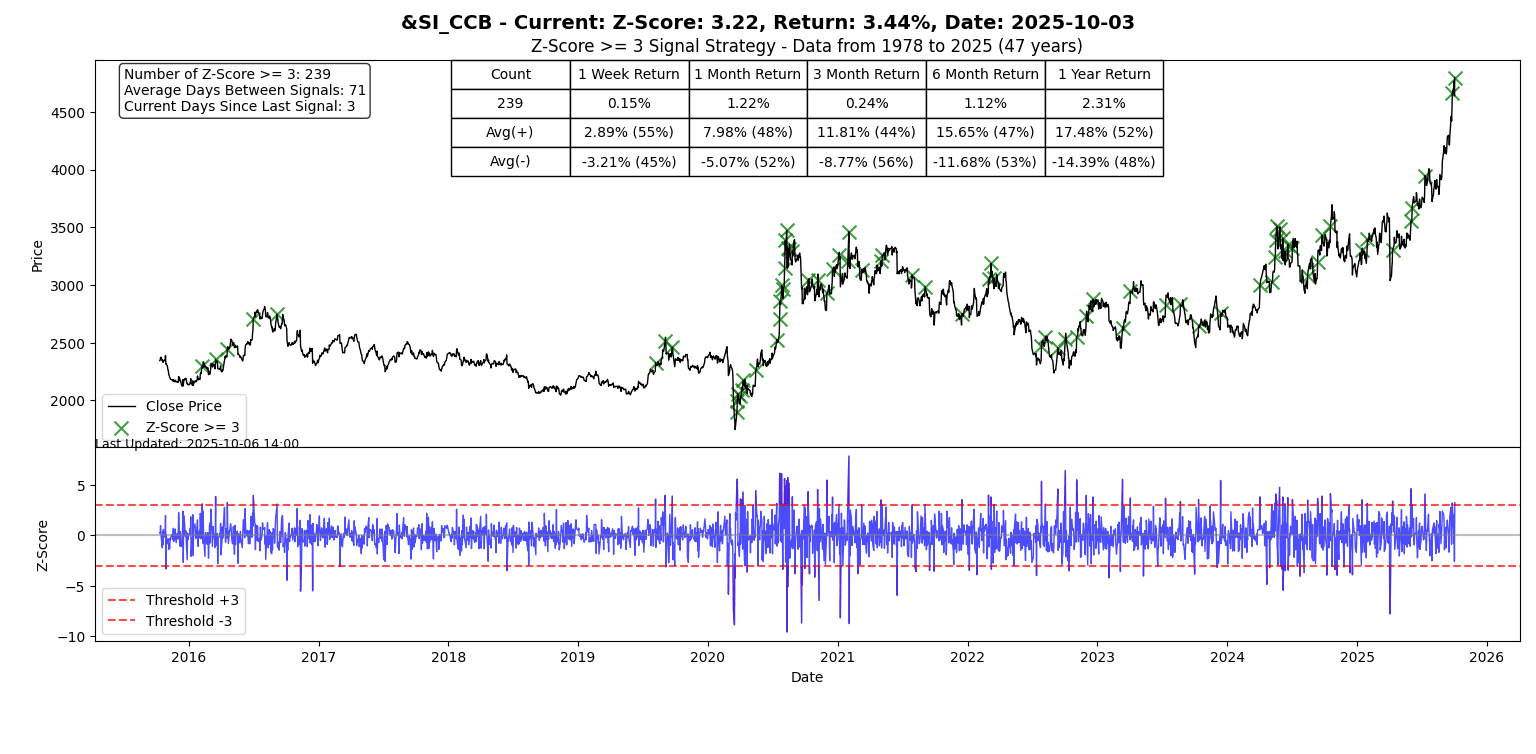
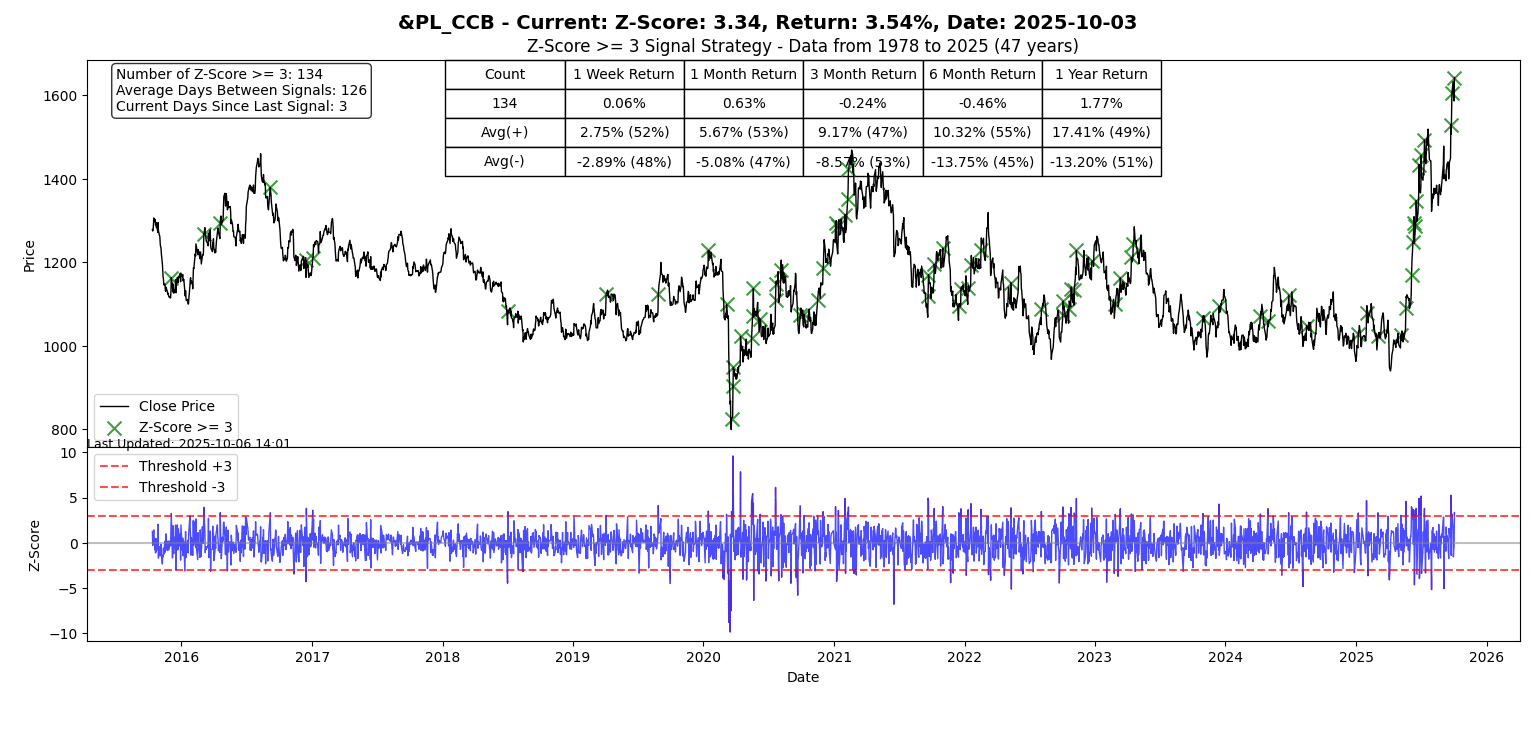
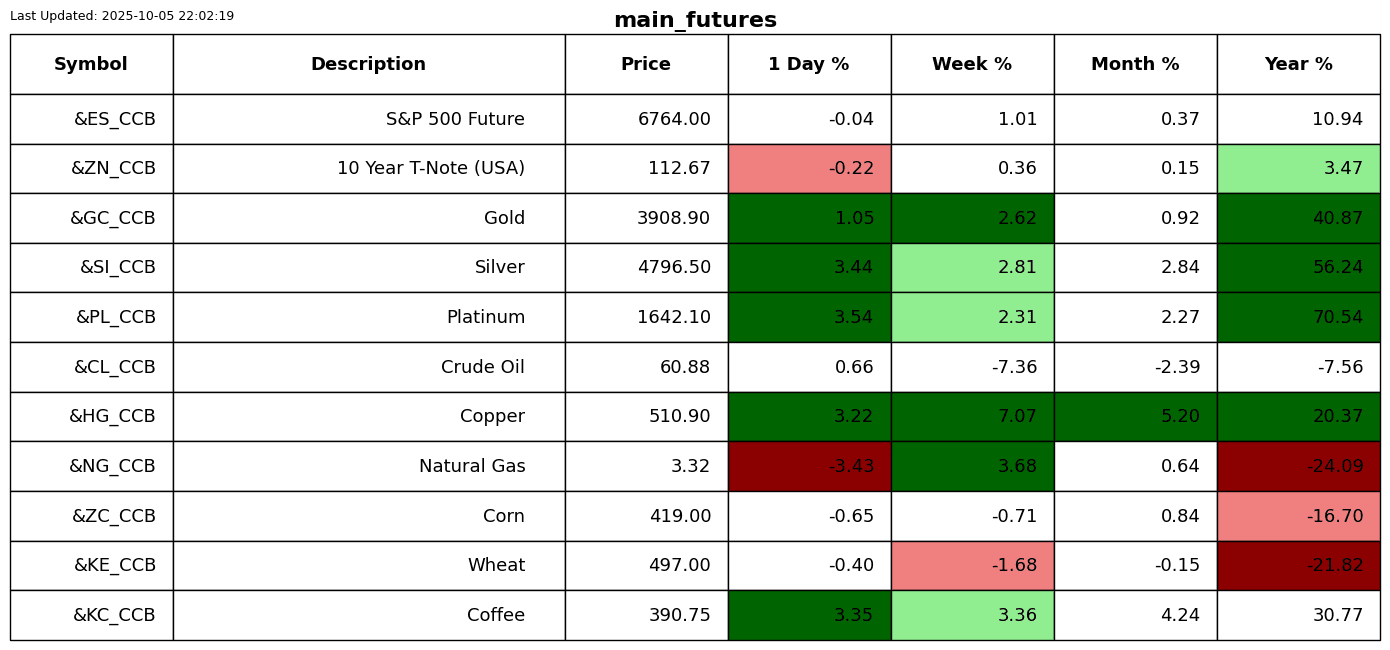
Silver and Platinum both had big 3 Z-Score up days.

Chart
Chart

S2N performance review

Chart
Chart
Chart
Chart
Chart
Chart
Chart

S2N chart gallery

Chart
Chart
Chart
Chart
Chart
Chart

S2N news today

Chart

Author

Michael Berman, PhD

Michael Berman, PhD

Signal2Noise (S2N) News

Michael has decades of experience as a professional trader, hedge fund manager and incubator of emerging traders.

More from Michael Berman, PhD
Share:

Editor's Picks

EUR/USD weakens to near 1.1900 as traders eye US data

EUR/USD eases to near 1.1900 in Tuesday's European trading hours, snapping the two-day winning streak. Markets turn cautious, lifting the haven demand for the US Dollar ahead of the release of key US economic data, including Retail Sales and ADP Employment Change 4-week average.

GBP/USD stays in the red below 1.3700 on renewed USD demand

GBP/USD trades on a weaker note below 1.3700 in the European session on Tuesday. The pair faces challenges due to renewed US Dollar demand, UK political risks and rising expectations of a March Bank of England rate cut. The immediate focus is now on the US Retail Sales data. 

Gold sticks to modest losses above $5,000 ahead of US data

Gold sticks to modest intraday losses through the first half of the European session, though it holds comfortably above the $5,000 psychological mark and the daily swing low. The outcome of Japan's snap election on Sunday removes political uncertainty, which along with signs of easing tensions in the Middle East, remains supportive of the upbeat market mood. This turns out to be a key factor exerting downward pressure on the safe-haven precious metal.

Bitcoin Cash trades lower, risks dead-cat bounce amid bearish signals

Bitcoin Cash trades in the red below $522 at the time of writing on Tuesday, after multiple rejections at key resistance. BCH’s derivatives and on-chain indicators point to growing bearish sentiment and raise the risk of a dead-cat bounce toward lower support levels.

Follow the money, what USD/JPY in Tokyo is really telling you

Over the past two Tokyo sessions, this has not been a rate story. Not even close. Interest rate differentials have been spectators, not drivers. What has moved USD/JPY in local hours has been flow and flow alone.

Bitcoin Cash trades lower, risks dead-cat bounce amid bearish signals

Bitcoin Cash (BCH) trades in the red below $522 at the time of writing on Tuesday, after multiple rejections at key resistance. BCH’s derivatives and on-chain indicators point to growing bearish sentiment and raise the risk of a dead-cat bounce toward lower support levels.