How the US-China trade dispute is redefining global trade

Since Donald Trump took office in 2017, trade flows and market shares have changed substantially. We think that shift is set to continue under looming tariffs and a new protectionist environment.
China’s declining US market share
The global market landscape has undergone significant transformations since the onset of the US-China trade dispute in 2018. The imposition of tariffs and a shift towards protectionism have forced companies on both sides of the Pacific to rethink their supply chains and sourcing strategies. Chinese firms, in particular, have seen a notable decline in their US market share.
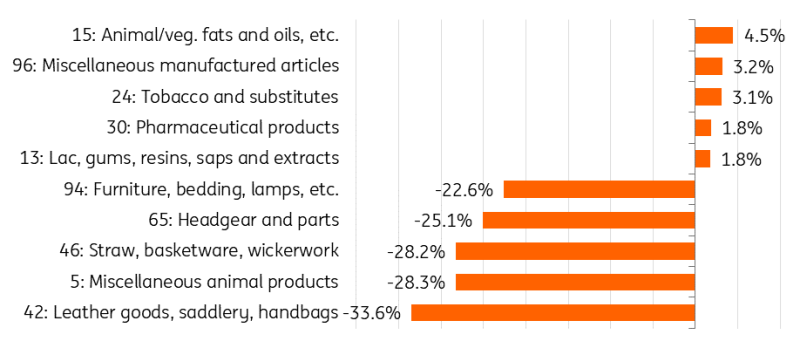
By 2023, China’s overall market share in the US had dropped by 7.7 percentage points to 13.9%, with even steeper declines in tariff-affected sectors. For instance, the market share for Chinese leather goods and furniture plummeted from 57.2% to 23.7%, and from 52% to 29.4% to between 2017 and 2023.
Sectors in which the Chinese market share in the US has shifted the most between 2017 and 2023
(%-points, HS2).
Source: LSEG Datastream; Global Trade Tracker, ING
Despite tariffs, China remains a key import source for the US
Despite the overall decline, not all sectors have suffered. China has managed to increase its market share in specific areas, such as animal and vegetable fats, tobacco and pharmaceutical products and miscellaneous manufactured articles, albeit from a relatively low base for the former three categories.
More importantly, though, China remains the most crucial source of imports from key Asian countries for the US. While hefty tariffs have somewhat reduced the country's direct dependency on Chinese imports, they have not led to a complete departure.
US imports from selected Asian countries ($bn)
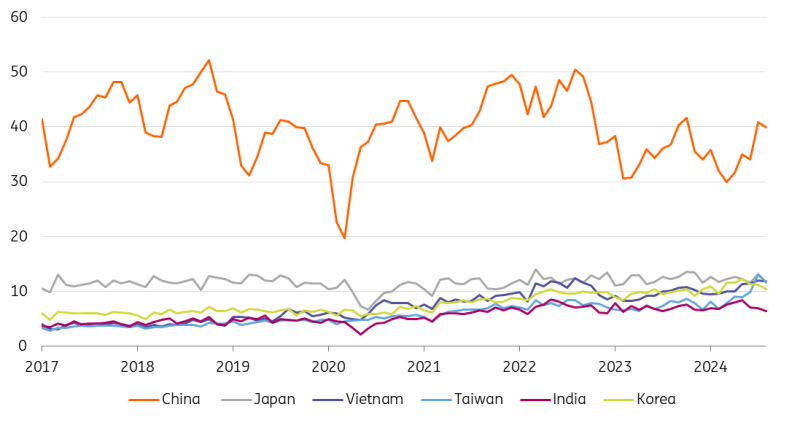
Source: LSEG Datastream, ING
When two people quarrel, the third benefits
Still, the tariffs on Chinese goods have prompted companies to seek alternatives, with some shifting production to other countries to avoid the tariffs. As trade in goods between the US and China has declined, both nations have sought out other markets, leading to significant gains for some countries. Between 2017 and 2023, the share of imports into the US from the EU, Mexico, and Vietnam increased by 2.4ppt, 2.1ppt, and 1.7ppt respectively. Additionally, Taiwan, Canada and South Korea have also boosted their export market share to the US by 1ppt.
Share in total US imports (%)
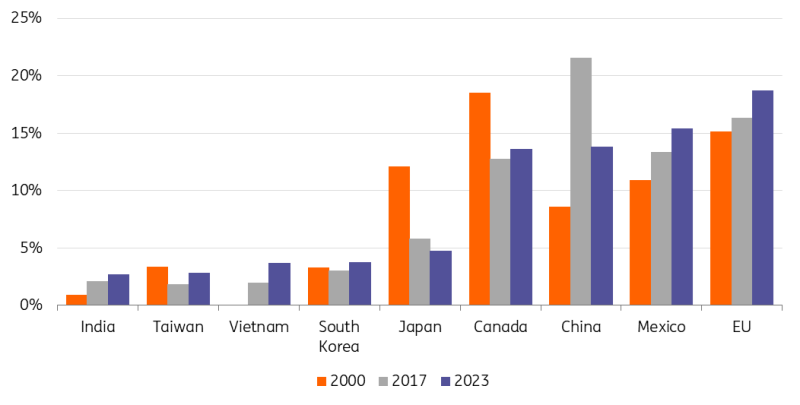
Source: LSEG Datastream, ING
Some changes are due to recent trade conflicts, but not all shifts can be directly attributed to the escalation. Supply chain adjustments are influenced by competitive dynamics, environmental considerations, consumer preferences, and regulatory aspects. While a tougher trade environment has driven many changes, it’s crucial to recognise that the multi-faceted nature of supply chains also plays a role here.
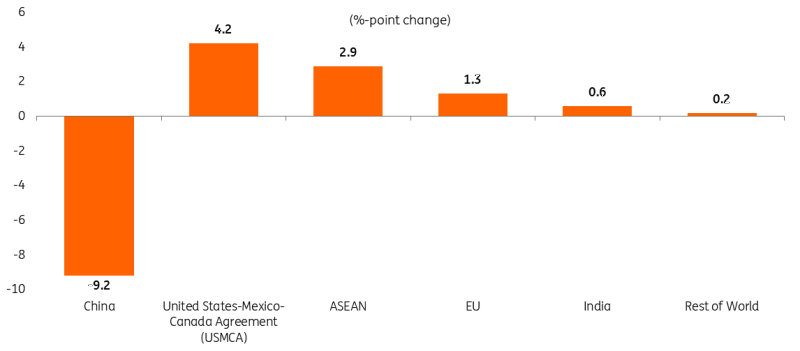
It is therefore useful to look at the share of imports subject to additional tariffs, such as those under Section 301. The USTR report reveals that several countries have benefited; Mexico and Canada saw their market shares increase by 4.2 and 2.9ppt respectively. The EU and India also made gains, with increases of 1.3 and 0.6ppt each.
Market share changes of US imports for Section 301 Products (Lists 1-4A)
2023 vs. 2017.
Source: Office of the U.S. Trade Representative; U.S. Census
China, on the other hand, has increased its exports primarily to Russia, Vietnam, Africa, the EU and Mexico. Overall, it seems that Mexico and Vietnam may serve as “plus one” countries, acting as intermediaries for China’s trade with the US and vice versa.
How tariff policies could Impact Vietnam, Mexico, and many more
This time around, however, those beneficiaries might get caught in the crossfire. Mexico is already in the spotlight not because of its trade policies, but due to immigration – and looking ahead, it might face increased scrutiny and renewed tariff threats stemming from actual trade imbalances. Additionally, the bigger threat from a new trade war could come from the US administration targeting foreign companies operating in third countries like Mexico or Vietnam, and potentially even targeting goods passing through Chinese-operated ports worldwide. There is still immense uncertainty about trade policies for the next four years, but being prepared for multiple potential scenarios might be the best approach.
We will also be closely monitoring the US currency manipulator list, as this might provide a hint about who will be targeted next. While no trading partners met all the criteria required to be labelled a currency manipulator in the June 2024 report, seven economies were put on the US Treasury list for monitoring: China, Japan, Taiwan, Malaysia, Singapore, Vietnam, and Germany.
Trade will be a primary focus under Trump’s renewed presidency – and in turn, the supply chain landscape, trade flows and market shares will continue to evolve as we enter a new era of protectionism with looming tariffs.
Read the original analysis: How the US-China trade dispute is redefining global trade
Author

ING Global Economics Team
ING Economic and Financial Analysis
From Trump to trade, FX to Brexit, ING’s global economists have it covered. Go to ING.com/THINK to stay a step ahead.