How (not) to do forex hedging – Technical analysis: GBP/USD, NZD/USD, EUR/JPY

Weekly thoughts
An often misunderstood way to reduce risk while keeping upside potential in forex trading is by hedging.
Let’s start with the way hedging should NOT be done (in our view).
Do not hedge as an alternative to a stop loss.
To those unfamiliar, it looks something like this.
1. You take a long position in EUR/USD.
2. But the trade doesn’t go as planned.
3. And you reach the point of not being able to take any more loss.
4. So you open a short position in EUR/USD.
The (incorrect) logic here is you don’t need to close the trade and take the loss but now if EUR/USD continues to go down, losses in the original long position are offset by gains on the new short position.
Here’s the problem with this..
You’re not actually reducing your risk, you’re just locking in a floating loss.
By opening an equal and opposite position, you’ve effectively frozen your account balance at a loss. The market can go up, down, or sideways, but your equity won’t improve unless you make an active decision to close one of the positions. This can create analysis paralysis where traders don’t know which leg to close or when, and end up holding both indefinitely while swap fees and opportunity cost eat away at their account.
This kind of hedging isn’t strategic. It's emotional. It’s usually driven by the desire to avoid taking a loss rather than manage risk objectively. And worse still, it leaves you with two positions to manage instead of one, complicating your decisions and often leading to further mistakes.
How should hedging be used?
Hedging in forex works best when it’s part of a pre-planned strategy, often involving correlated pairs or multiple timeframes.
In fact, this week’s market setup gives us a good example of strategic hedging in action.
Among the many setups we look at to include in the weekly analysis, we identified these three potential opportunities:
- Short GBP/USD.
- Short USD/CAD.
- Long NZD/USD.
Out of these, we chose GBP/USD and NZD/USD and excluded USD/CAD, and here’s why:
Taking opposing positions in these two pairs hedges your US dollar exposure.
Think of it this way: the US dollar is the dominant currency in both trades. If you’re short GBP/USD and long NZD/USD, you’re effectively betting on a weaker pound and a stronger kiwi but the USD sits on opposite sides of each trade. So, if the dollar makes a strong move in either direction, it’s unlikely both positions will lose at the same time.
This kind of hedging doesn’t eliminate risk, but it balances it. You’re still exposed to the unique fundamentals of GBP and NZD, but you’re not going “all in” on the direction of the dollar, which in uncertain weeks, can make a big difference to your outcome.
In this case, the hedge has a clear purpose and exit plan. It’s not about avoiding a loss; it’s about limiting directional exposure.
To sum up:
● Hedging isn’t a get-out-of-jail-free card for bad trades.
● Use hedging to navigate strong correlations across major USD pairs.
Setups and signals
We look at hundreds of charts each week and present you with three of our favourite setups and signals.
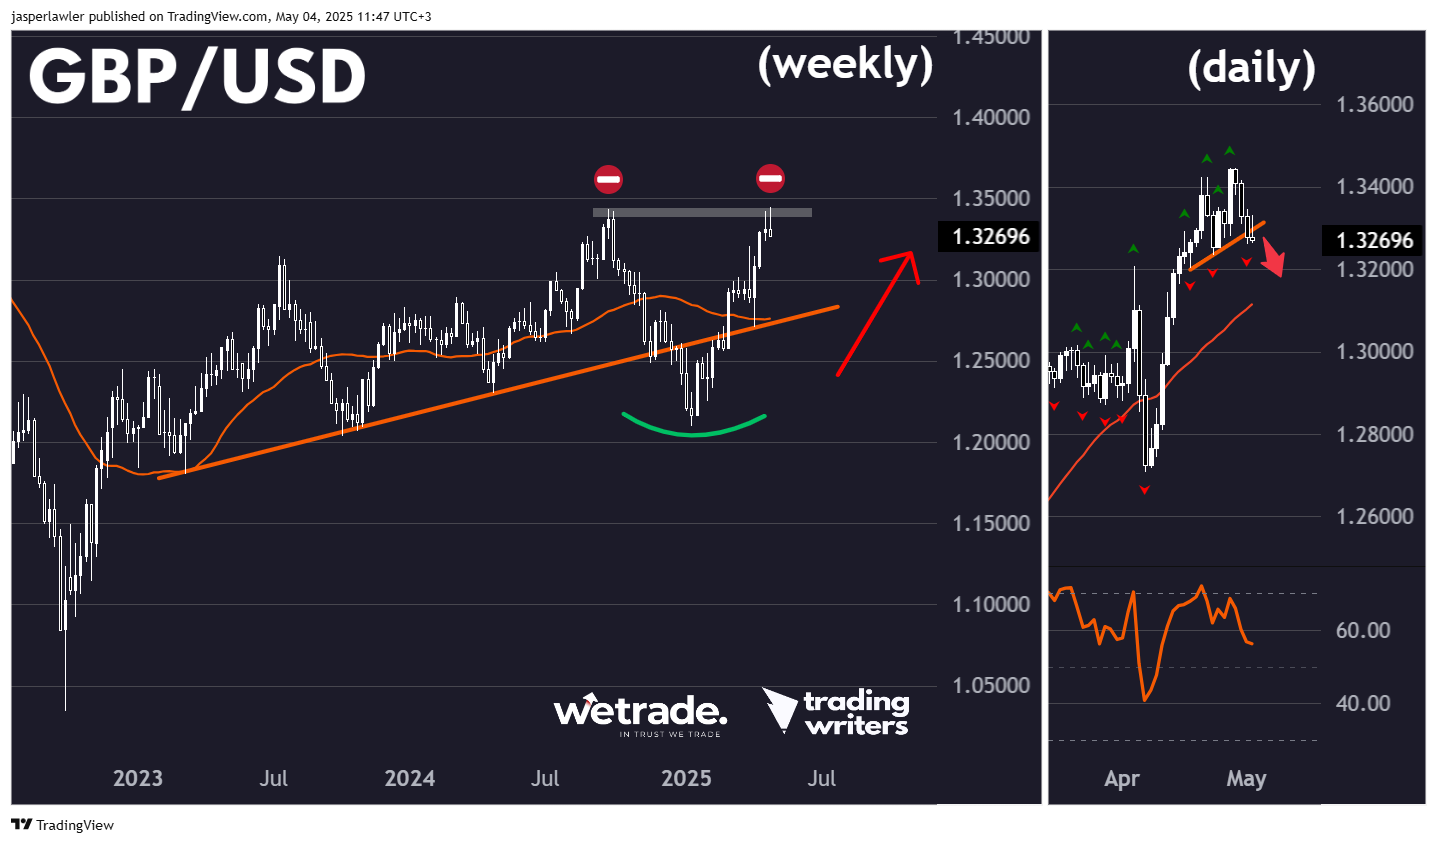
GBP/USD
Setup
The GBP/USD weekly candlestick chart has a slightly bullish bias but the 30-week moving average is flat and price has had a significant run higher (suggesting possible exhaustion) and is setting up a possible double top pattern. To confirm, there have been two weekly Shooting Star bearish reversal patterns in the past two weeks.
Signal
The risk of a false signal is higher because the daily chart is still in an uptrend. However, the the short up trendline break after RSI bearish divergence suggests a downside move that could target the 1.30 round number.
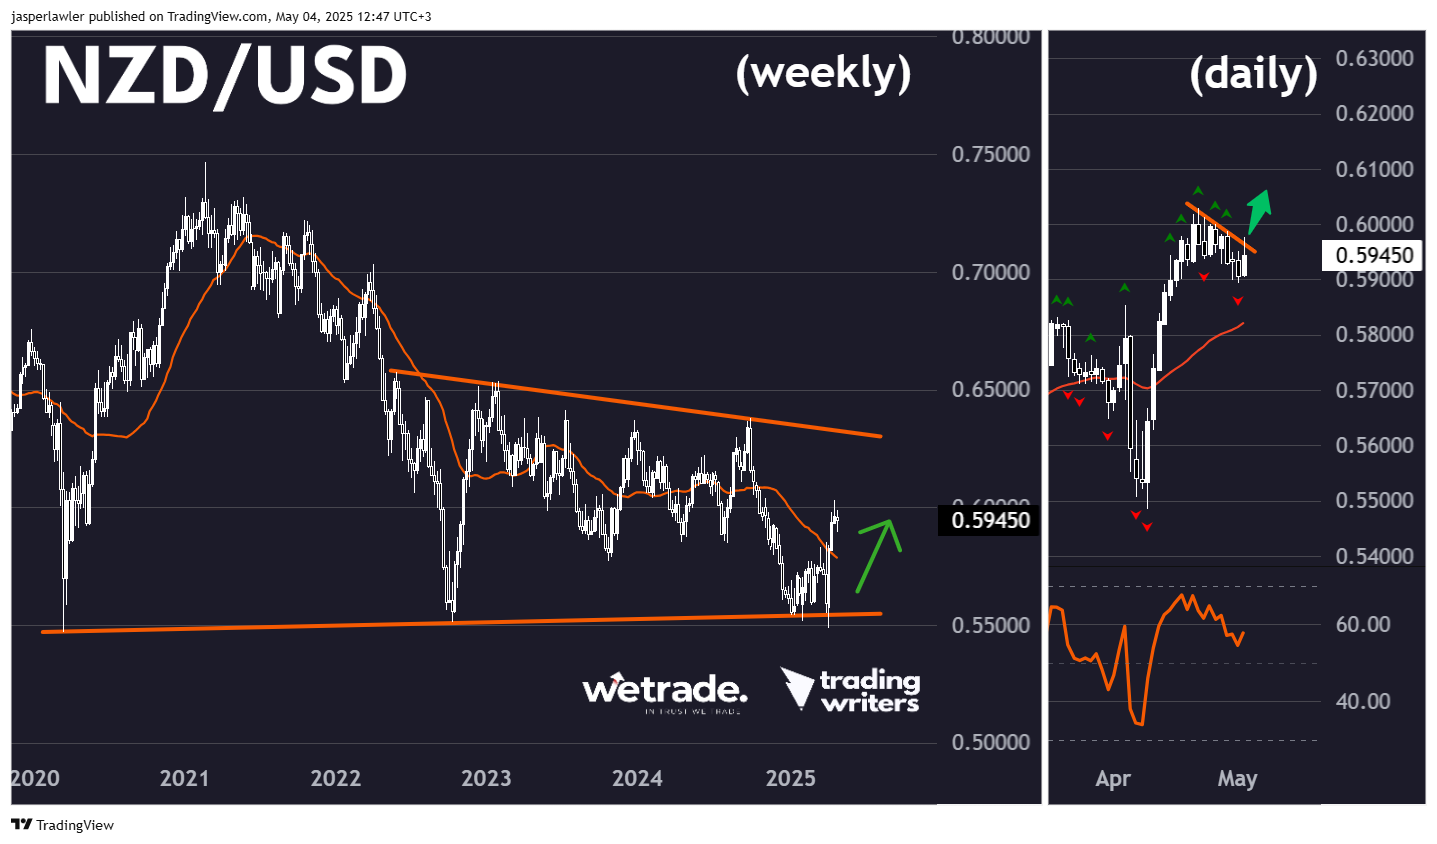
NZD/USD
Setup
There has been a strong rebound off the lows in NZD/USD with a completed double bottom pattern as part of a longer term wedge pattern. While no uptrend is established, the downtrend has ended. Thus NZD/USD offers a way to short USD as a hedge to the long USD position in GBP/USD.
Signal
RSI in a bullish regime and a possible bull flag continuation pattern just under the 0.60 round number suggests the upside momentum could continue towards the down trendline on the weekly chart.
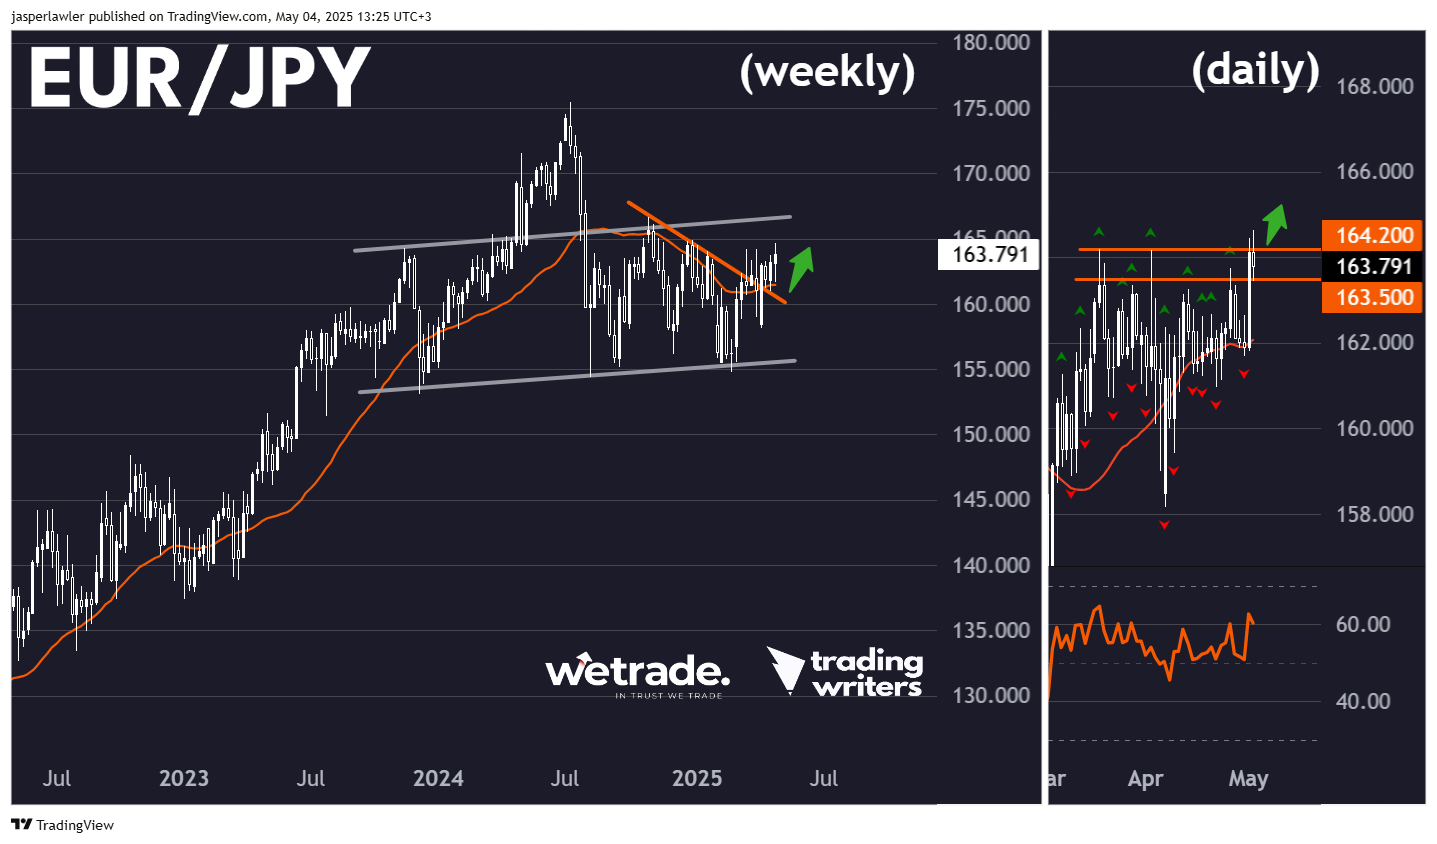
EUR/JPY
Setup
Regular readers will remember we have been watching EUR/JPY for months as a possible long term head and shoulders bearish reversal. But we need to stay flexible in our mindset. This bias in EUR/JPY appears to be flipping bullish as the price breaks a down trendline and holds above the 30 week SMA.
Signal
The breakout above recent peaks (and fractal highs) between 163.5-164.2 offers a possible signal to go long EUR/JPY with the November peak around 166 as well as the rising trendline connecting the ‘shoulders’ as a possible upside target.
Author

Jasper Lawler
Trading Writers
With 18 years of trading experience, Jasper began his career as a stockbroker on Wall Street in New York City before sharpening his analytical skills at top trading firms in the City of London.


