How long is Bitcoin (BTC) going to trade sideways against the rising altcoins?

Original content: How long is Bitcoin (BTC) going to trade sideways against the rising altcoins?
The market is neither totally bullish nor bearish as some coins are already located in the green zone, while others have come back to red.
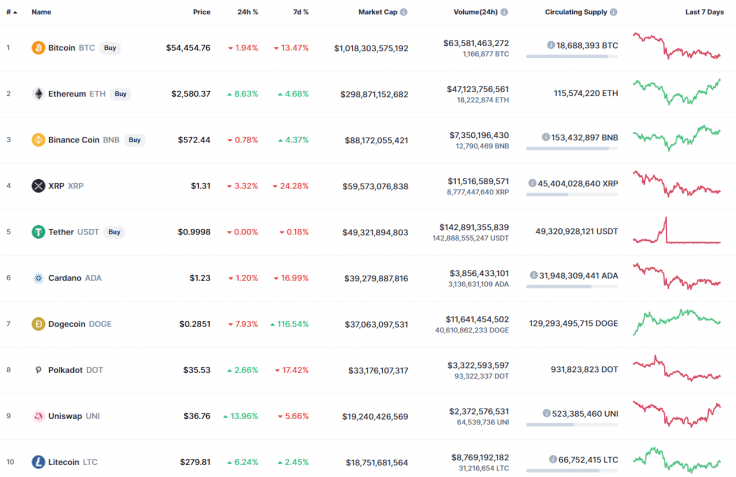
Top 10 coins by CoinMarketCap
BTC/USD
Bitcoin (BTC) is the only coin from our list that is still located under bearish influence. It has fallen by 2.16% over the past day.
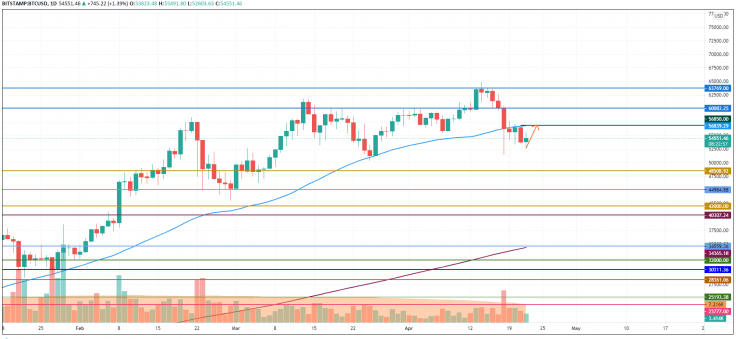
BTC/USD chart by TradingView
On the daily chart, Bitcoin (BTC) keeps trading sideways. However, after a bearish candle, buyers have seized the initiative and continue pushing the rate up. In this case, there are chances to attain the area of MA 50, around the $56,800 mark.
Bitcoin is trading at $54,540 at press time.
ETH/USD
Ethereum (ETH) has set the new peak today at the level of $2,606. The rise is 8.17%.
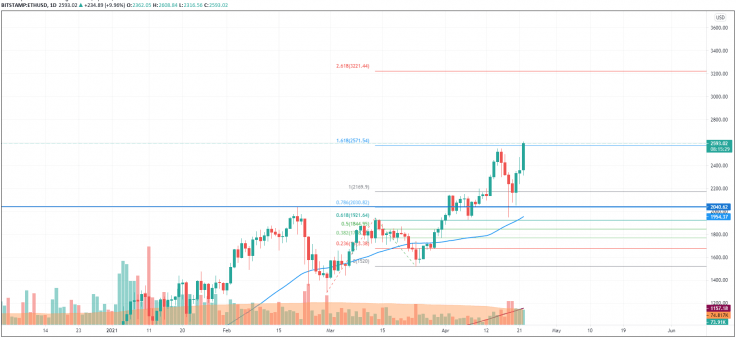
ETH/USD chart by TradingView
Applying the Fibonacci retracement on the chart, the peak may be located at the level of $3,200.
However, at the moment, the coin is overbought and consolidation in the range of $2,500-$2,600 is the most likely scenario for the upcoming days.
Ethereum is trading at $2,587 at press time.
UNI/USD
Uniswap (UNI) is the biggest gainer today as the rate of altcoin has risen by 14%.
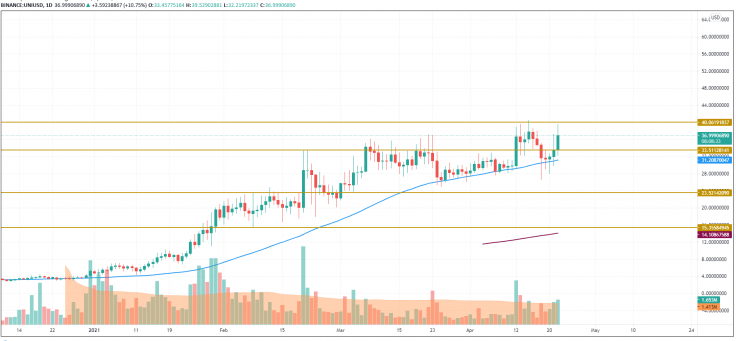
UNI/USD chart by TradingView
Despite the sharp growth, UNI is not going to stop rising. On the daily chart, it is about to reach the vital resistance level at $40.06. If bulls break it, the coin might show sharp growth.
UNI is trading at $37.09 at press time.
Read full original article on U.Today
Author

Denys Serhiichuk
U.Today
With more than 5 years of trading, Denys has a deep knowledge of both technical and fundamental market analysis.


