How large is China’s economy really?

Which country has the larger economy. Based on 2019 GDP China’s economy is about 2/3 the size of the USA but when adjusted for PPP (purchasing power parity) is about 1/3 bigger. In other words the PPP adjustment doubles the size of China’s economy relative to the US. But is this correct?
Using the expenditure method the US GDP ($21,729bn in 2019) is made up of approximately 66% personal consumption (of which 20% goods and 46% services), 17% investment and 17% Government expenditure (of which 3% is investment and 14% current expenditure). (St Louis Fed)
Let’s look at some facts!
China consumes:
- 30 times as much cement per annum as the US (World Cement)
- 11 times as much steel (World Steel)
- 8 times as much aluminium (World Aluminium)
China accounts for half of the world’s demand for flat glass, copper, nickel, tungsten, cobalt and rare earth metals and is also the largest consumer of zinc and tin.
All of the above indicate what is well known - that China has an enormous building boom with high rise buildings shooting up in cities all over the country where once stood mud huts. This is accompanied by massive infrastructure investments in road, rail, drainage, power generation and transmission, telecommunications etc. In addition China is also the workshop of the world with a manufacturing workforce eight times that of the US (Brookings; West & Lansang, July 2018) that is also competitive internationally based on costs and productivity.
Why then does the PPP figure not indicate an economy multiple times bigger than that of the US? There are several reasons:
(i) The PPP adjustment is made by taking a basket of goods and services in different countries and comparing their prices. These are then weighted to determine an average. However if the weighting in the basket changes then so will the answer. Most of the activity described above will not be picked up by the PPP method since that method is weighted towards consumption. Investment is weighted based on it’s share in the developed countries.
(ii) There are indications that China understates it’s building sector in it’s GDP by as much as a factor of four with several contradictory figures on the government’s own website. (data.stats.gov.cn)
(iii) A major share of the services component of GDP in the US is made up of health and education but how do you compare these with China. There is actual spending on these sectors and then there is the cost but given that China has four times the population who live almost as long and whose younger generations have comparable levels of educational attainment as in the US would it not be fair to say that spending adjusted for cost should show the Chinese sectors almost four times as large?
In order to get a meaningful comparison between the two economies it is necessary, in my view, to set out a number of underlying assumptions:
(a) Comparisons of services should be excluded on the grounds that in market economies services innovation will occur in any event and a cost/quality comparison leads nowhere.
(b) The PPP comparisons should apply to the consumption of durable and non-durable goods only.
(c) Construction investment should be calculated by taking the US as the base and by quantifying in square meters and square kilometres the volume of construction in any year. The corresponding volume for China (or any other country) would then be determined as a multiple or fraction of this volume. This multiple or fraction would then be applied to the US construction GDP instead of the PPP. In the case of China, given the known inputs of cement, steel etc, we would be talking about a factor of 13 times or more.
(d) We are assuming that in construction, manufacturing and R&D there are no productivity differences. In fact, in developing countries lower productivity tends to be a phenomenon in the agricultural and retail sectors but less so if at all in construction and manufacturing.
Regarding industrial capital and equipment China invests about three times as much as the US based on GDP at market value (Mondor Intelligence) but China’s industrial wages are only one quarter of US wages. Such investments absorb a proportionate share of China’s enormous metals consumption and therefore, in real terms, they are many times larger than the US - let’s say 10 times.
On the R&D side this can be adjusted on a PPP basis (assuming the underlying data are directly comparable) but for this article I have assumed that China’s figure is the same as the US figure.
Thus we have the following:
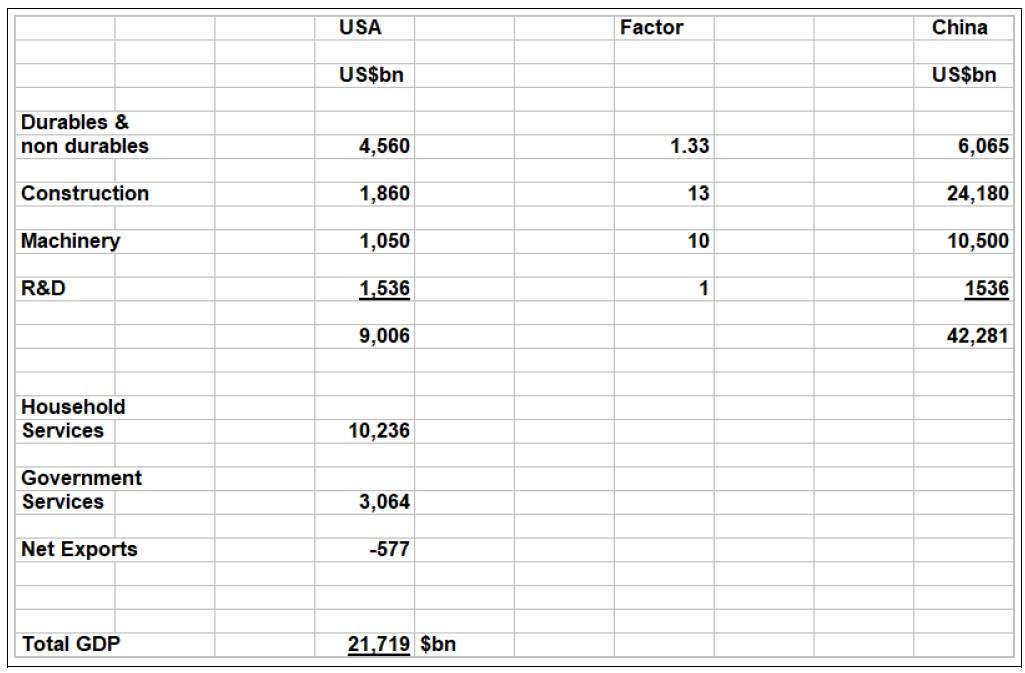
Now it can be seen from the table that using this methodology China’s economy, ignoring services, is more than four times as large as the US economy.
Author

Paul Dixon
Latin Report
Paul Dixon’s focus is economics from a long term perspective.


