How Far Will Gold Reach Before the Upcoming Reversal?

Just when most traders thought that the previous week is going to end in the red for gold, something exceptional happened. The USD Index reversed after rallying, and gold rallied sharply in response. In the end, gold ended the week in the green by forming a clear weekly reversal.
That was actually the second weekly reversal that we saw recently. Why is this important? Because of what happened shortly after we saw the opposite of it not so long ago.
The Anatomy of Gold Reversals
-637109482118924631.png)
The August and early-September reversals were followed by sizable short-term declines and the combined reversals themselves have most likely created the 2019 top.
The opposite of what created the major top, should create a major bottom now, right? Not so fast. The double reversal is indeed bullish, but there’s one more detail to pay attention to before calling a major bottom in gold. Gold’s volume.
The volume that accompanied the August and September reversals was big, and the volume that we saw recently – especially last week – was small. Sure, it was the long Thanksgiving weekend, which means that fewer traders were making transactions, which explains why the volume was low. Still, knowing what’s below the low volume’s surface doesn’t change the fact that low volume means that the candlestick formations (like the weekly reversal) should not be taken at face value. They give some hints, but they are not as reliable as if they took place on huge volume.
The recent situation is more similar to what we saw in early March. There was a clear weekly reversal, but it was accompanied by low volume. And what happened shortly thereafter? Gold rallied, but not significantly so. At least not within the next several weeks. This tells us that the recent reversals – while bullish – are not too bullish and not beyond the next week or a few of them. Perhaps not even beyond the next several days.
What would one use to forecast a top in gold prices within this week?
The Case for the Upcoming Gold Top
Because of the looming triangle-vertex based turning point. The recent turning points for gold, silver and mining stocks worked perfectly by pinpointing the early November top, and they also correctly estimated the most recent reversals – the local bottoms after which gold, silver and miners moved higher.
The early November top is clearest in case of silver (middle of the above chart), while the recent local bottoms are most clearly visible in case of gold miners (lower part of the chart).
The next triangle reversal is due this week, which makes it likely that we’ll see some kind of turnaround shortly. The important details about this turnaround is that it’s confirmed by not one but two markets – silver and miners, which increases the odds that the reversal will indeed take place. The early-November top, for instance, was indicated by all three parts of the PM market at once.
Let’s keep in mind that it’s not the only factor pointing to this outcome. The True Seasonality for gold confirms the above.
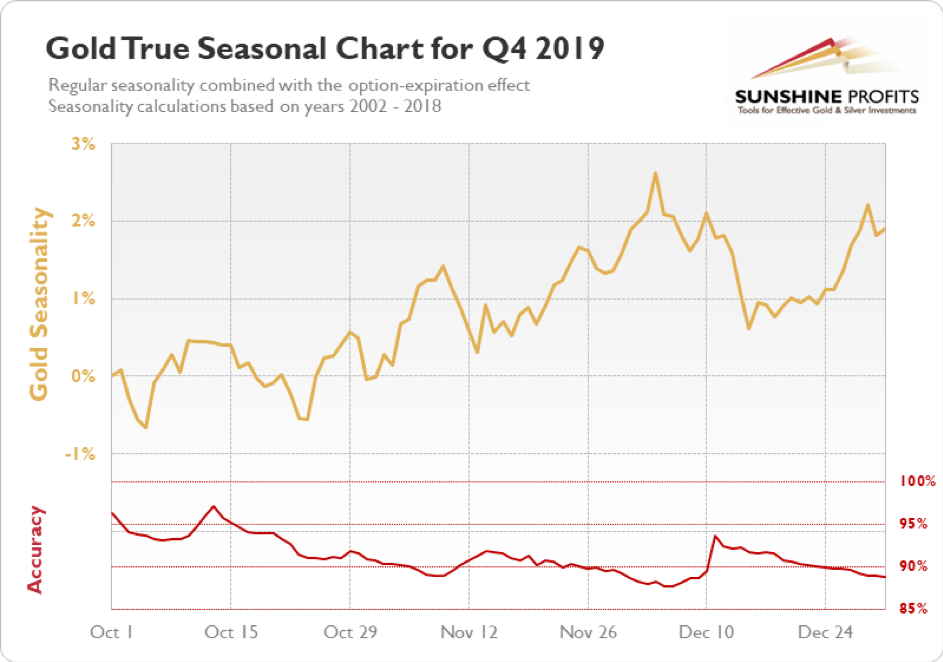
On average, gold price has been spiking around late November and early December. Please note that while on average gold performs best in late November, the accuracy reading actually rises strongly in the next several days. This means that while the biggest price moves usually happened sooner, some of them arrive a bit late. When gold soared sooner, it didn’t decline immediately. The take-away here is that even if the above is not 100% correct, and price spike doesn’t happen right away, it means that it’s still likely to arrive shortly.
Based on the weekly candlestick reversals in gold, the looming triangle reversals, gold’s True Seasonality, and other factors, it seems that gold is going to rally and top shortly.
Want free follow-ups to the above article and details not available to 99%+ investors? Sign up to our free newsletter today!
Want free follow-ups to the above article and details not available to 99%+ investors? Sign up to our free newsletter today!
Author

Przemyslaw Radomski, CFA
Sunshine Profits
Przemyslaw Radomski, CFA (PR) is a precious metals investor and analyst who takes advantage of the emotionality on the markets, and invites you to do the same. His company, Sunshine Profits, publishes analytical software that any


