Housing Slump Accelerates

Starts and permits both came in well below consensus estimates, with revisions negative.
Lower mortgage rates have not helped new home construction. Both starts and permits are not only well below the Econoday consensus range, but also lower than the lowest estimates.
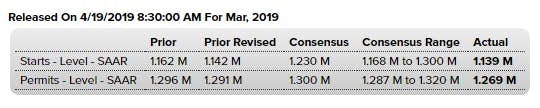
Housing starts came in far below expectations in March, at a 1.139 million annual rate which is nearly 30,000 below Econoday's consensus range. And permits aren't any better, at a 1.269 million rate and nearly 20,000 below the low estimate.
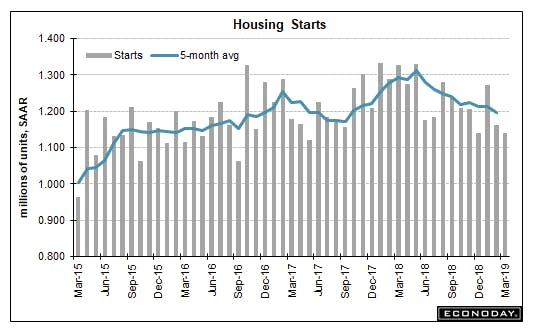
The trend is clearly downward with starts the weakest since May 2017 and permits the weakest since August last year. Year-on-year rates are minus 14.2 percent for starts and minus 7.8 percent for permits. Goods news in the report is scarce but does include a welcome 11.9 percent monthly jump in single-family completions at a 938,000 rate for a new home sales market that needs fresh supply.
But another key reading, permits for single-family homes, fell 1.1 percent in March and are down 5.1 percent year-on-year. Low mortgage rates may be helping purchase applications but have yet to trigger much response from home builders.
However strong the jobs market may be, residential investment was the consistent tail ender in last year's GPD statistics and doesn't look like it will be improving in the first quarter. Regional data show a March uptick for starts and permits in the West, where home prices have completely flattened, though year-on-year rates here remain deeply negative. All regions in fact are in the negative year-on-year columns whether for starts or permits.
New Residential Construction
Let's tune into the New Residential Construction report for more details.
- Privately‐owned housing units authorized by building permits in March were at a seasonally adjusted annual rate of 1,269,000. This is 1.7 percent below the revised February rate of 1,291,000 and is 7.8 percent below the March 2018 rate of 1,377,000.
- This is 1.7 percent below the revised February rate of 1,291,000 and is 7.8 percent below the March 2018 rate of 1,377,000.
- Single‐family authorizations in March were at a rate of 808,000; this is 1.1 percent below the revised February figure of 817,000. Authorizations of units in buildings with five units or more were at a rate of 425,000 in March.
Housing Starts
- Privately‐owned housing starts in March were at a seasonally adjusted annual rate of 1,139,000. This is 0.3 percent below the revised February estimate of 1,142,000 and is 14.2 percent below the March 2018 rate of 1,327,000.
- Single‐family housing starts in March were at a rate of 785,000; this is 0.4 percent below the revised February figure of 788,000. The March rate for units in buildings with five units or more was 337,000.
Housing Completions
- Privately‐owned housing completions in March were at a seasonally adjusted annual rate of 1,313,000.
- This is 1.9 percent below the revised February estimate of 1,338,000, but is 6.8 percent above the March 2018 rate of 1,229,000.
- Single‐family housing completions in March were at a rate of 938,000; this is 11.9 percent above the revised February rate of 838,000. The March rate for units in buildings with five units or more was 364,000.
Starts, Permits, Completions
Synopsis
- Compared to a year ago, starts are down 14.2%, permits are down 7.8%, and completions are up 6.8%.
- Compared to February, starts are down 0.3%, permits are down 1.7%, and completions are up1.9%
Numbers are volatile, but the data strongly suggests that builders are finishing homes at close to the peak rate, but not starting new ones.
Author

Mike “Mish” Shedlock's
Sitka Pacific Capital Management,Llc
Mike “Mish” Shedlock is a registered investment advisor for SitkaPacific Capital Management.


