Household Financial Behavior Part II: Pressure Points

When does the evolution of household finances break down? We highlight the issues of housing leverage, the debt service ratio and the saving rate as pressure points that could signal a break in consumer finance patterns.
Volatility Is the Character of the Housing Market
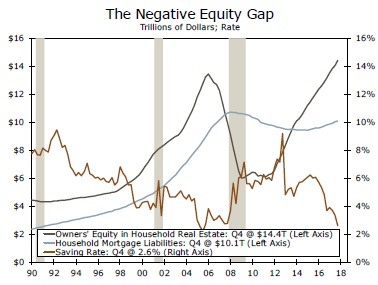
To say that housing is cyclical is to restate a cliché. The top graph illustrates the volatility and structural breaks that characterize the asset side (owner's equity) and the liability side (mortgages) of the housing finance market. Given this volatility, our statistical analysis leads us to believe that the assets and liabilities side of the housing finance market are non-mean reverting. This diminishes the prospect of finding a reliable forecasting method for either series. Moreover, the structural breaks in both series intimate that changes in housing finances are abrupt and are likely to be unanticipated. While the conditions for housing corrections may exist, the precise timing to reliably forecast such a correction remains elusive.
Evaluating Credit Pressures Amid Unpredictability
It is important for decision makers to note that especially since assets and liabilities are non-stationary, we cannot evaluate the series in terms of causality. We do not know which series leads the other in creating a trend, and it would be misleading to attempt to argue one way or the other. Series such as the household debt service ratio (DSR), middle graph, illustrate the problem of abrupt and unanticipated change. The DSR declined 34 percent between its peak in Q4-2007 and its trough in Q4-2012, yet has risen only 4 percent since that time. The DSR ratio, and its cousin, the financial obligations ratio, are also characterized by structural breaks. This reaffirms our view that prior trends are not necessarily telling of future trends.
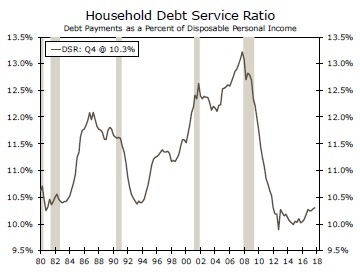
However, this presents a problem for credit. Auto and mortgage loans are made over a significant period of time. Auto loans today, for example, go out five to seven years. Yet, looking at the middle graph, we can see that credit decisions to take on a loan made midway through an economic expansion (1984-1985, 1994-1996 and 2004-2006) often precede a rapid rise in the debt service ratio and a commensurate period of pressure on consumer finances. Household delinquencies are sure to follow.
Animal Spirits and Economic Cycles: Explaining Abrupt Behavior
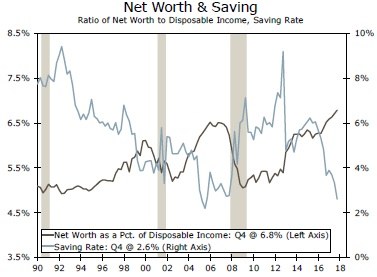
Animal spirits are a characteristic of households as well as entrepreneurs, as we have written about previously.* As evidenced by the bottom graph, as the economic cycle improves through a strengthening labor market and rising incomes, households have a tendency to reduce their saving rate (1992- 2000, 2005-2006 and 2014-2018). Animal spirits then lead consumers to become more optimistic. Household net worth increases over the cycle as equity in housing improves as well. Yet, we also observe that this relationship can go the other way, in that consumers can pull back their spending when they are less optimistic. Unfortunately, the net worth and saving series are characterized by structural breaks. Once again, historical trends should not be used to predict future changes in behavior.
Author

Wells Fargo Research Team
Wells Fargo


