Hints at a tax reform climb-down hits the dollar

Market Overview
On a week light on tier one economic data, the focus is on how tax reform is progressing. However in negotiations to try and sweeten the bill, there are suggestions that there could be somewhat of a climb-down as the Republicans could delay the cuts to corporation tax by twelve months. This is hitting yields of longer dated Treasuries and as shorter dated yields hold up, is significantly flattening the yield curve further. This is shown on the 2s/10s spread which is now below 68 basis points. The dollar rally is certainly being hampered by this, but as yet has not been shoved off course. However a tightening on the 10 year Bund/Treasury spread needs to be watched for EUR/USD, as does the divergence between the US 10 year yield and moves on Dollar/Yen. The oil price is also just beginning to pare some of its recent sharp gains after Monday’s upside break on tensions within the Saudi kingdom , including the anti-corruption crackdown but also a spat with Iran over Yemen. These issues have dragged oil prices to record levels on the RSI technical momentum indicator but the move is beginning to unwind now.

Wall Street closed relatively subdued despite an all-time high on the Dow, whilst the S&P 500 was marginally softer, -0.02% at 2590. Asian markets closed mixed after the Chinese trade data was fairly close to expectation and did little to drive risk, with the Nikkei closing -0.1%. European markets were hit yesterday and again seem to be continuing this near term dip back today. In forex, the dollar is coming under a little corrective pressure across the major pairs, with the greenback between 0.1% to 0.2% weaker, all except against a relatively underperforming sterling. Gold is also benefitting from this weaker dollar, around $3 higher (or around 0.2%), whilst oil is beginning to unwind its strong gains of recent weeks, around -0.5% lower.
The quiet week continues today with no major economic data due during the early European session. The EIA oil inventories are at 1530GMT and are expected to show crude oil stocks in drawdown by -2.9m barrels (last week -2.4m barrels), distillates by -1.4m (last week -0.3m) and gasoline by -2.0m barrels (last week -4.0m). The Reserve Bank of New Zealand monetary policy at 2000GMT is the main data point of the day which is expected to hold rates steady at +1.75%.
Chart of the Day – AUD/USD
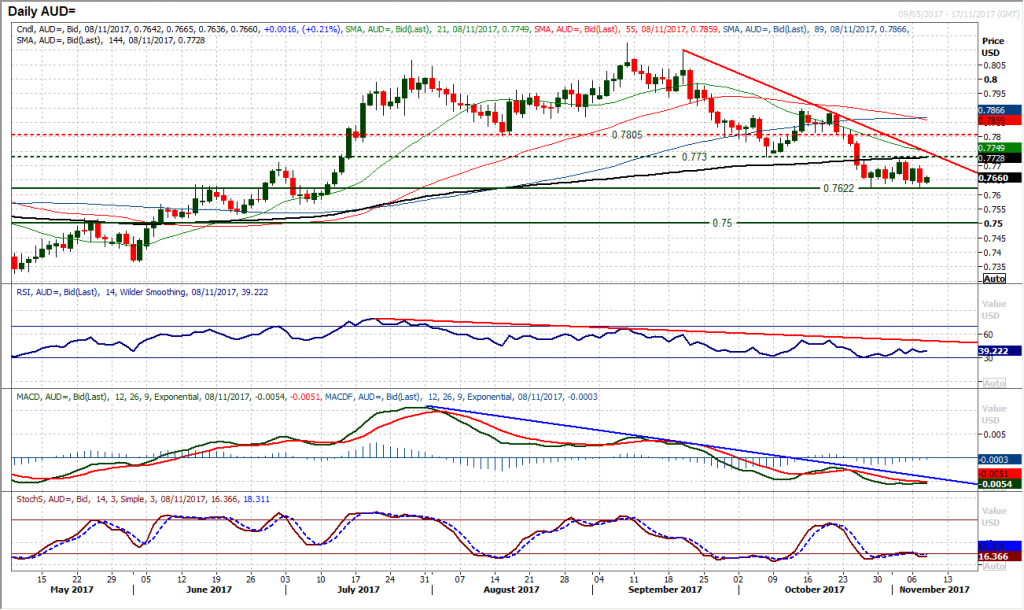
The outlook for the Aussie remains negative in the wake of the RBA monetary policy decision. With a near term rally failing at the resistance of the old support at $0.7730, yesterday’s strong negative candle has driven the pair back lower once more to test the support at $0.7622. The medium term downside pressure suggests that pressure on this support will continue. Today’s early rebound is also likely to give another chance to sell. This comes with the continued negative configuration on the momentum indicators. The daily RSI is trending lower, having failed around 50 during October, the RSI is now failing around 40. Furthermore, the MACD lines are trending lower below neutral and the Stochastics are turning lower once more. This all suggests selling rallies as the market fails at lower levels. The downside pressure is growing and a closing breach of $0.7622 means a move towards the long term pivot at $0.7500 would be increasingly likely. The market would have to negotiate the initial support of the July low at $0.7567. Resistance at $0.7730 is now key, whilst the hourly chart shows initial resistance at yesterday’s high of $0.7300.
EUR/USD
The market is beginning to now pull decisively below, away from the neckline resistance at $1.1660 to continue the corrective move on EUR/USD. This comes with yesterday’s negative candle that contained an intraday move below $1.1575 to a three and a half month low. The momentum indicators are all negative configured but also with downside potential, with the RSI falling below 40, MACD lines in decline below neutral and the Stochastics below 20. This all suggests that intraday rallies should be sold into. The resistance of the neckline around $1.1660 has merely been bolstered by the moves of the past couple of weeks too. The hourly chart shows the hourly RSI failing around 60 and hourly MACD lines failing around neutral whilst the hourly Stochastics are also rolling over around selling levels this morning. Initial resistance is at $1.1605 and then $1.1625. A retest of $1.1552 can be expected before $1.1475 and further downside in due course.

GBP/USD
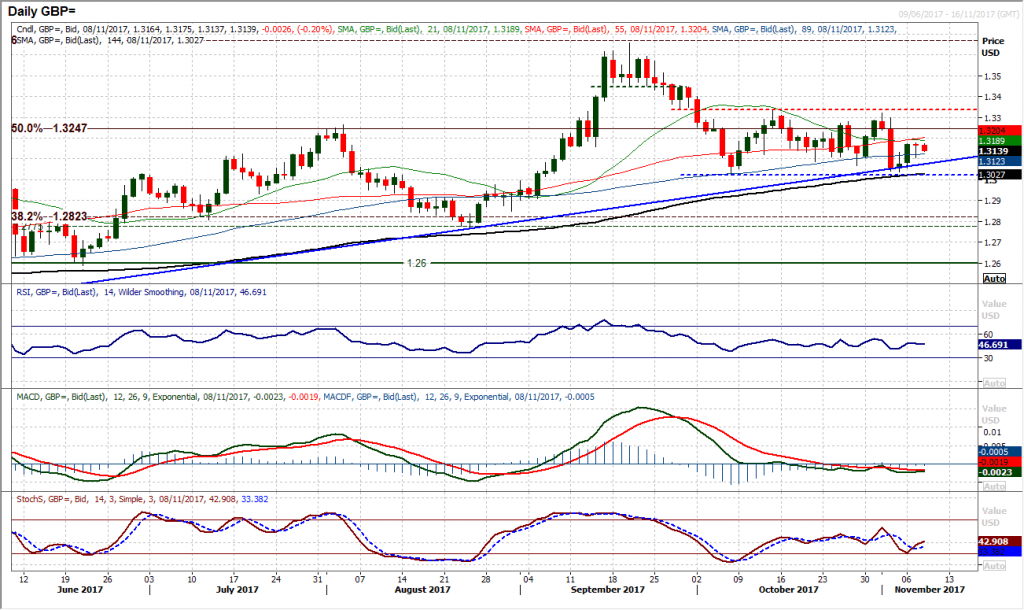
Cable has held on well to the confluence of support that has come in recently around $1.3025. For now the consolidation range of the past five weeks between $1.3025/$1.3335 continues and the rebound largely drive by Monday’s strong bull candle is now back around the middle of that range. This move continues the somewhat benign and ranging configuration of the near term momentum indicators. However there is still the slight negative bias with the RSI oscillating between 40/55 and the MACD lines sitting slightly below neutral. Yesterday’s choppy session has left a slightly indecisive looking candle but now means there is support at $1.3105 to watch as a near term higher low. This comes as the hourly momentum indicators threaten to roll over again. Initial resistance at $1.3175 before $1.3230.
USD/JPY
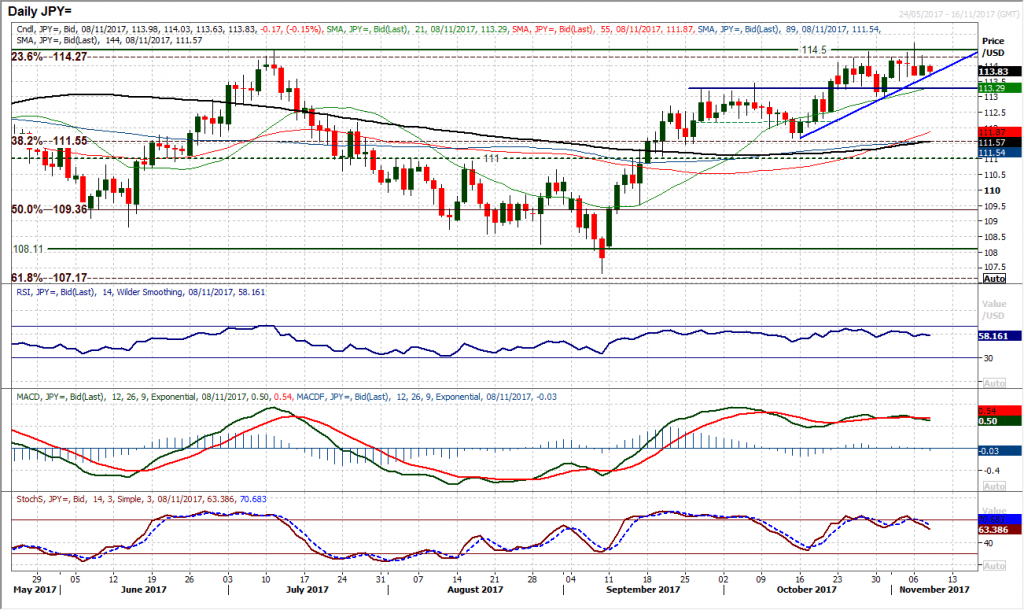
The market has been throwing off a number of conflicting candles in the past week however yesterday’s positive candle has held on to a near term trend higher of three weeks and means that the bulls remain in control for a sustained test of the 114.50 old key resistance. Momentum indicators remain positively configured however there is less conviction in the outlook now, with the MACD and Stochastics lines just tailing off slightly now. Once more an intraday push towards 114.50 could not be sustained yesterday and with the converging uptrend today in at 113.65, the Average True Range of 77 pips suggests that the situation will come to a head in the next couple of days. The hourly chart reflects a range play over the past week with initial resistance at 114.33, with support around 113.65. A close above 114.50 is needed to breakout to the upside, whilst 112.95 remains key support.
Gold
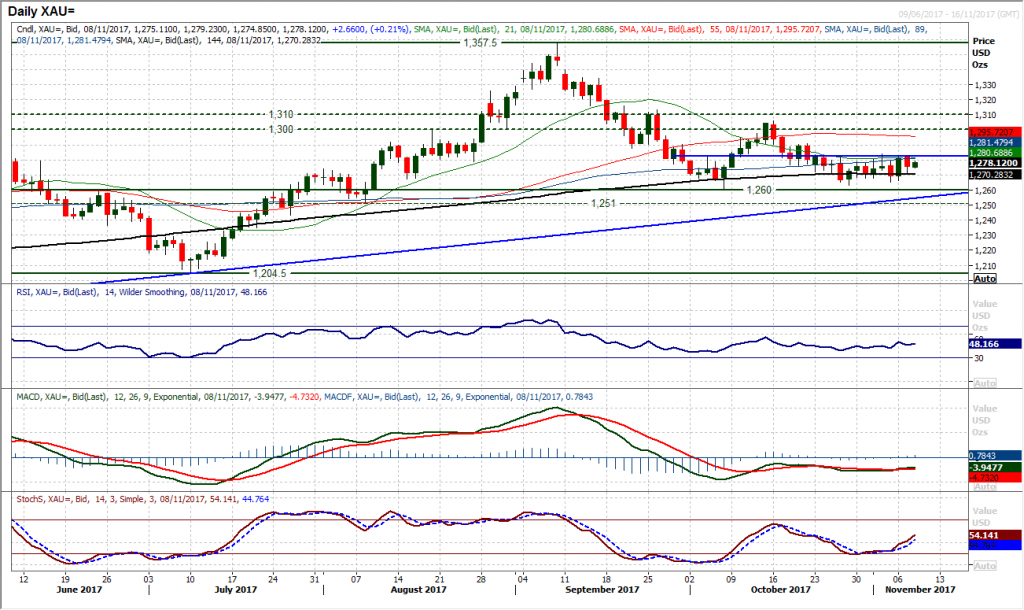
In the past two weeks, every time there has been the slightest hint at direction, be it higher or lower, the market has shut down the move. A strong positive candle of Monday once again tested the near term resistance at $1284 which has capped the upside in the past couple of weeks, however the move was unwound by yesterday’s drop back. Purely on a price basis, the market posted a low at $1263.30 and a higher low at $1265.10, however the upside pressure on the resistance at $1284 seems to be greater. There is little real direction to make a decisive move for the breakout of this $21 range with momentum indicators broadly flat. It would need a closing breakout above $1284 or below $1263 to drive near term direction, theoretically giving a $21 implied target. However there is key resistance at $1290 and $1300/$1310, whilst $1251/$1260 is supportive.
WTI Oil
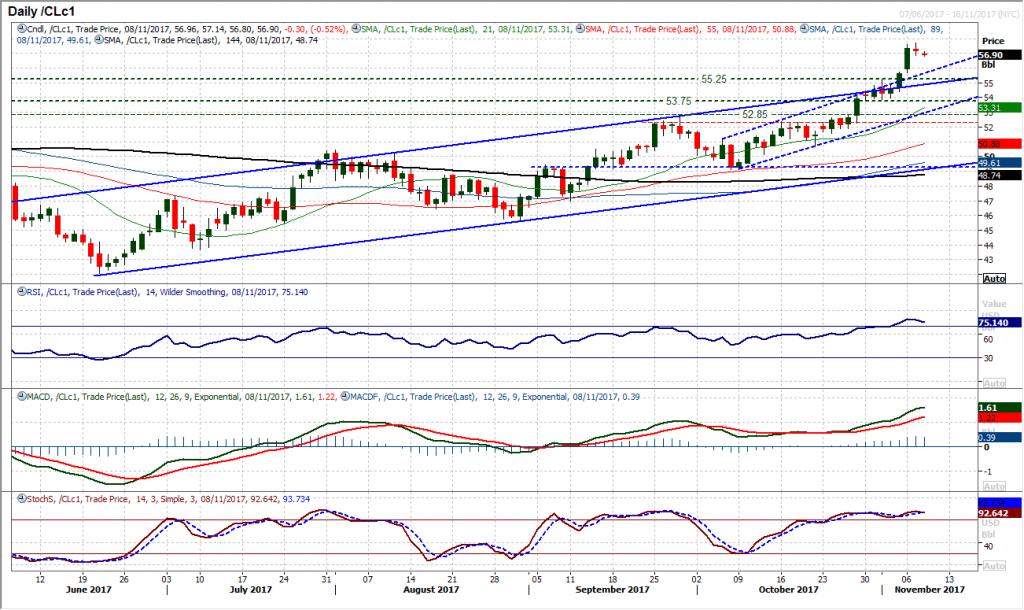
With the sharp upside break into new two year highs on WTI the market has just taken a pause for breath. Posting a slight decline on the day the small bodied candle reflects a consolidation of the breakout. The momentum is incredibly strong but also extremely stretched now and this drastically increases the potential for a near term unwinding move. The RSI closing yesterday at over 78 back from 79 the day before are the highest closing levels since April 2006, but also the RSI has rolled over. This does come with the MACD and Stochastics also very strong, but with early moves today again lower, the market is shaping for a near term correction. The bulls will certainly be looking at holding on to the breakout above $55.25. The hourly chart could hold the clues to profit taking with the hourly RSI consistently finding lows 35/45 whilst the MACD lines are above neutral. The hourly chart shows resistance at $57.70 whilst initial support is $55.70/$56.30.
Dow Jones Industrial Average
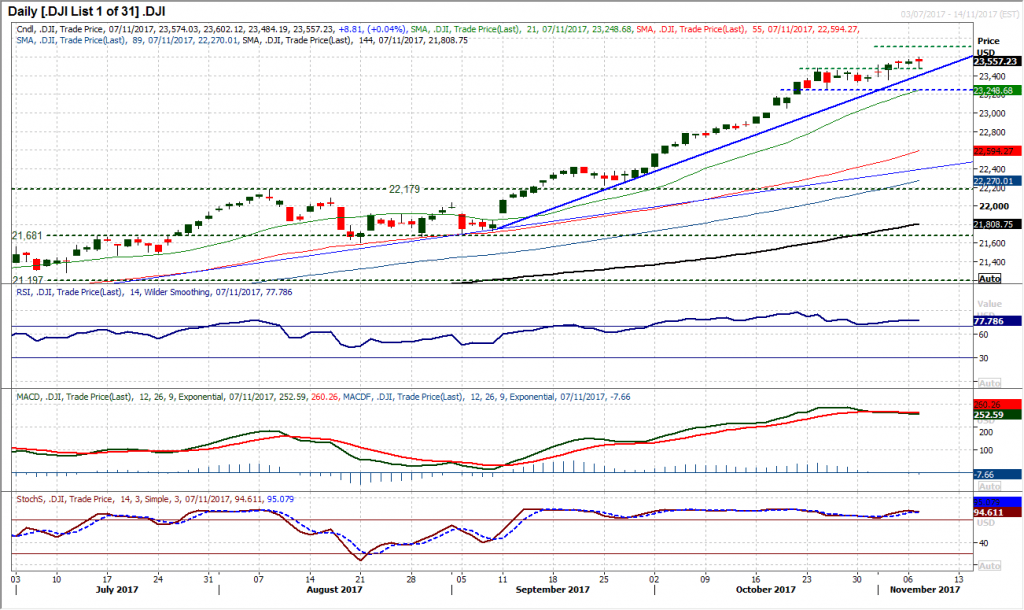
The bull trend continues to drive a near to medium term upside bias on the Dow. The outlook remains a buy into weakness and yesterday’s mildly negative candle was again seen as a near term opportunity for the bulls. The market unwound to bounce from the breakout support at 23,485 to hold on to the medium term uptrend. However at the same time the market continues to give off other signals that the trend is maturing. This comes with the MACD lines that are starting to cross lower and reflect a market that is beginning to run out of steam. The emphasis will now be on how the bulls respond to today’s session. A second consecutive bear candle with a negative close has not been seen since September and would increase the potential for a correction. For now though the bulls remain in control, with the uptrend supporting at 23,440 today. Yesterday’s high at 23,602 is the all-time high and is initial resistance now.
Author

Richard Perry
Independent Analyst


