|

Here is how to spot the market bottom using Wyckoff method and market breadth [Video]

Original content: Here is how to spot the market bottom using Wyckoff method and market breadth [Video]

Here is how the price structure of the S&P 500 could look like if the low in May 2022 marked the market bottom without the market capitulation based on Wyckoff trading method and market breadth.

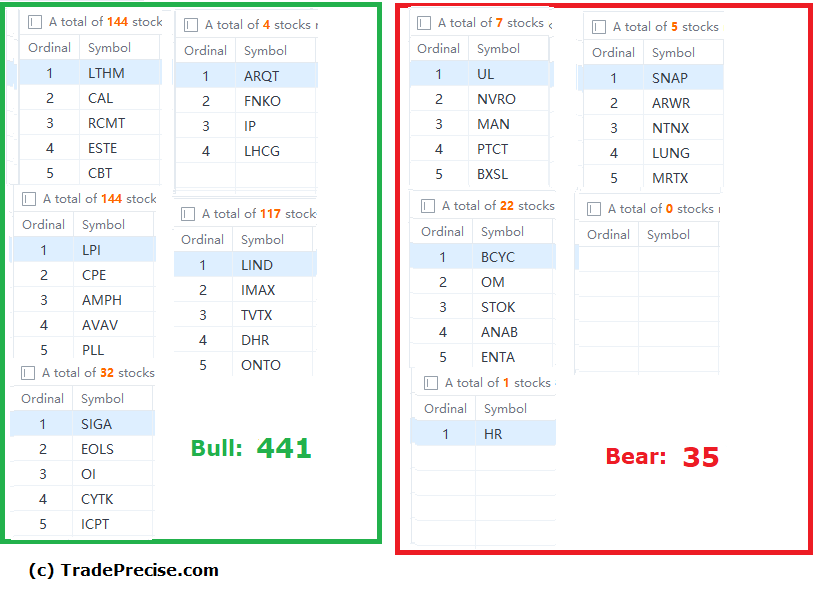
The bullish setup vs. bearish setup is 441 vs 35 from the screenshot of my stock screener below. This is a significant change from last week where lots of the stocks participated the rebound.

Chart

For trading tactics, aggressive traders could look for deeply oversold technology stocks or the leadership stocks in the oil and gas industry group. Bear in mind that a counter-trend rally is generally risky not to mention about the elevated volatility in both direction, which could whipsaw the bull and the bear.

Author

Ming Jong Tey

Ming Jong Tey

Independent Analyst

Ming Jong Tey has been trading since 2008. He started his learning journey from technical analysis (indicators, Fibonacci, etc...) to value investing. Throughout his journey, he develops an interest in price action with chart pattern trading.

More from Ming Jong Tey
Share:

Editor's Picks

EUR/USD looks sidelined around 1.1850

EUR/USD remains on the back foot, extending its bearish tone and sliding towards the 1.1850 area to print fresh daily lows on Monday. The move lower comes as the US Dollar gathers modest traction, with thin liquidity and subdued volatility amplifying price swings amid the US market holiday.

GBP/USD flirts with daily lows near 1.3630

GBP/USD has quickly given back Friday’s solid gains, turning lower at the start of the week and drifting back towards the 1.3630 area. The focus now shifts squarely to Tuesday’s UK labour market report, which is likely to keep the quid firmly in the spotlight and could set the tone for Cable’s next move.

Gold loses momentum, eases below $5,000

Gold is giving back part of Friday’s sharp rebound, deflating below the key $5,000 mark per troy ounce as the new week gets underway. Modest gains in the US Dollar are keeping the metal in check, while thin trading conditions, due to the Presidents Day holiday in the US, are adding to the choppy and hesitant tone across markets.

Bitcoin consolidates as on-chain data show mixed signals

Bitcoin price has consolidated between $65,700 and $72,000 over the past nine days, with no clear directional bias. US-listed spot ETFs recorded a $359.91 million weekly outflow, marking the fourth consecutive week of withdrawals.

The week ahead: Key inflation readings and why the AI trade could be overdone

It is likely to be a quiet start to the week, with US markets closed on Monday for Presidents Day. European markets are higher across the board and gold is clinging to the $5,000 level after the tamer than expected CPI report in the US reduced haven flows to precious metals.

XRP steadies in narrow range as fund inflows, futures interest rise

Ripple is trading in a narrow range between $1.45 (immediate support) and $1.50 (resistance) at the time of writing on Monday. The remittance token extended its recovery last week, peaking at $1.67 on Sunday from the weekly open at $1.43.