Hang Seng Index Technical analysis: Will the HK50 price rebound?
Hang Seng Index Technical analysis summary
Buy Stop: Above 24839.3
Stop Loss: Below 24020.3
| Indicator | Signal |
| RSI | Buy |
| MACD | Buy |
| Donchian Channel | Buy |
| MA(200) | Sell |
| Fractals | Buy |
| Parabolic SAR | Buy |
Hang Seng Index chart analysis
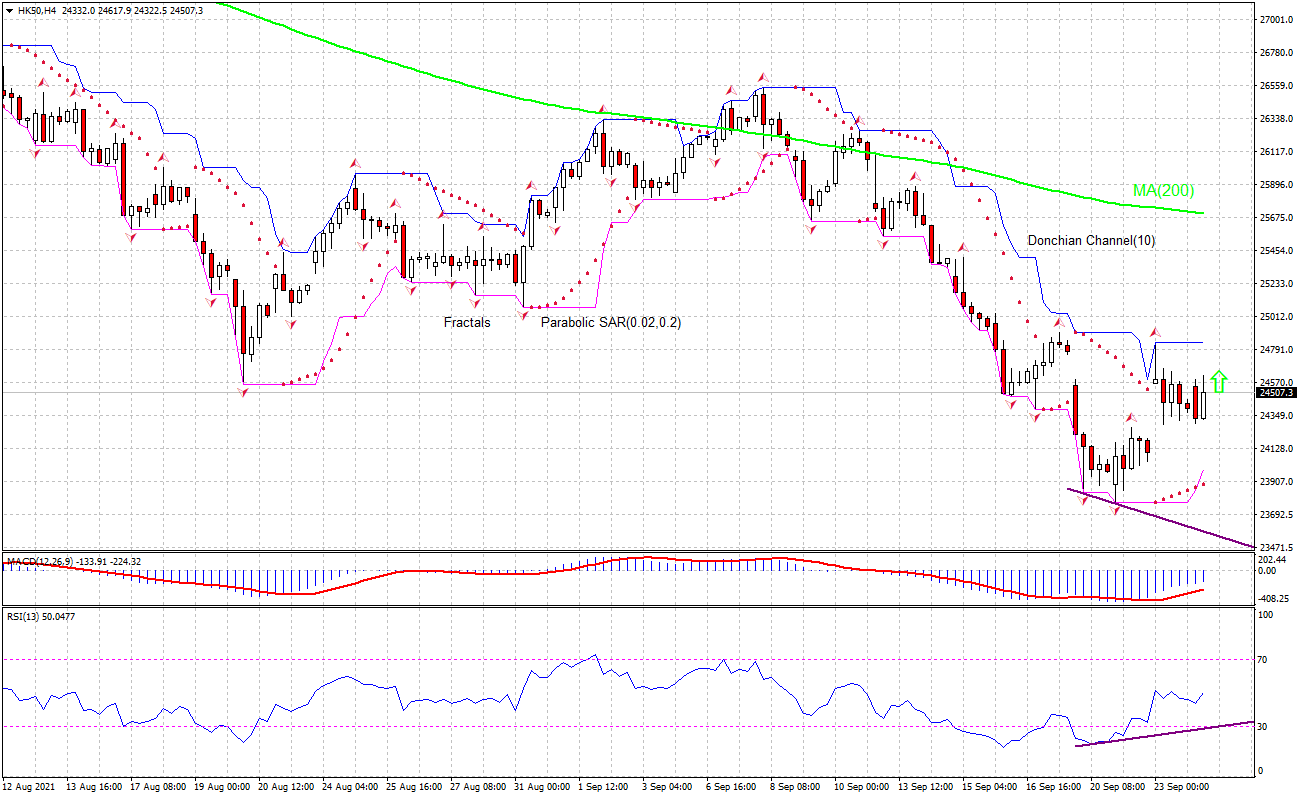
The technical analysis of the HK50 price chart in the 4-hour timeframe shows the HK50,H4 is attempting to rebound to the 200-period moving average MA(200) which is falling still. The RSI indicator has formed a bullish divergence. We believe the bullish momentum will continue after the price breaches above the upper Donchian boundary at 24839.3. This level can be used as an entry point for placing a pending order to buy. The stop loss can be placed below the lower Donchian boundary at 24020.3. After placing the pending order the stop loss is to be moved every day to the next fractal low, following Parabolic indicator signals. Thus, we are changing the expected profit/loss ratio to the breakeven point. If the price meets the stop-loss level (24020.3) without reaching the order (24839.3) we recommend cancelling the order: the market sustains internal changes which were not taken into account.
Fundamental analysis of indices - Hang Seng Index
HK50 price forecast is bullish despite recent mixed data. Will the HK50 price rebound ?
Hong Kong economic data of the last couple of weeks were mixed. Unemployment declined in August though less than forecast. And inflation declined more than expected. On the positive side the current account surplus rose in the second quarter when a decline was forecast. Thus, unemployment declined to 4.7% from 5% in July when a decline to 4.5% was expected. Inflation rate fell to 1.7% from 3.7% in July when a decline to 1.8% was expected. And current account surplus rose to H$68.5 billion from H$60.6 billion in Q1 when a decline to H$43 billion was forecast.
Want to get more free analytics? Open Demo Account now to get daily news and analytical materials.
Want to get more free analytics? Open Demo Account now to get daily news and analytical materials.
Author

Dmitry Lukashov
IFC Markets
Dimtry Lukashov is the senior analyst of IFC Markets. He started his professional career in the financial market as a trader interested in stocks and obligations.


