Gold's price continues to shine, albeit in a range

The price of the precious metal has been ostensibly range-trading since our last follow-up of its price action. The contributing factors to the somewhat muted price action are many, but few are worth pointing out. Firstly and most significantly, gold's massive bullish run was distorted after BioNTech and Pfizer flaunted an over 95 per cent efficiency of their Covid-19 vaccine in preventing symptomatic infections in clinical trials of thousands of volunteers, which caused considerable investors' enthusiasm.
Many market participants anticipate the vaccine to be a game-changer in the fight against the pandemic by allowing the global economic activity to reach pre-pandemic levels when there is a worldwide immunity. We have already laid out all of the potential reasons why this may not be the case so soon, but at any rate, the general market excitement has negated the global demand for safe-havens.
Secondly, the mostly uneventful past few weeks have so far had a calming impact on markets. With only a few releases of major economic data scheduled for this week, the levels of overall volatility are likely to wane significantly. That is so because fewer traders are likely to weigh in on any drastic surprises, which would result in overall diminished trading activity. Consequently, gold's already existing range-trading environment is more than likely to be complemented by decreased liquidity levels in the near term.
All of these contributing factors presuppose subdued trading of gold's price in the following days, which is likely to bounce within the two boundaries of the existing range.
1. Long-Term Outlook
The price of gold has been sliding consistently within the boundaries of a massive, downwards sloping channel since early-August, as can be seen on the daily chart below. Given the significance of the channel so far, the price action is likely to resume bouncing within its two boundaries in the future as well.
Moreover, the price action is locked within the borders of a substantial range, which spans between the 38.2 per cent Fibonacci retracement level at 1836.28 and the 23.6 per cent Fibonacci at 1927.24. The range itself can be used to determine the more immediate target levels for the price action.
Seeing as how the price action has apparently bottomed out around the current market price – 1875.00 per troy ounce – a rebound towards the 23.6 per cent Fibonacci seems more likely. There are several reasons to expect such a course of action. Firstly, the 100-day MA (in blue) is presently converging towards the range's upper limit, which would make it an even more significant resistance. Given the previous behaviour of the price action around the moving average, a test of its new role as a floating resistance seems highly plausible.
Secondly, the ADX indicator confirms the aforementioned range-trading environment. As can be seen, the indicator has been threading below the 25-point benchmark since the 25th of August, and below the 20-point mark since the 8th of October. This underpins a highly pronounced ranging bias, which, in turn, is more than suitable for sudden rebounds of the price from the range's two limits.
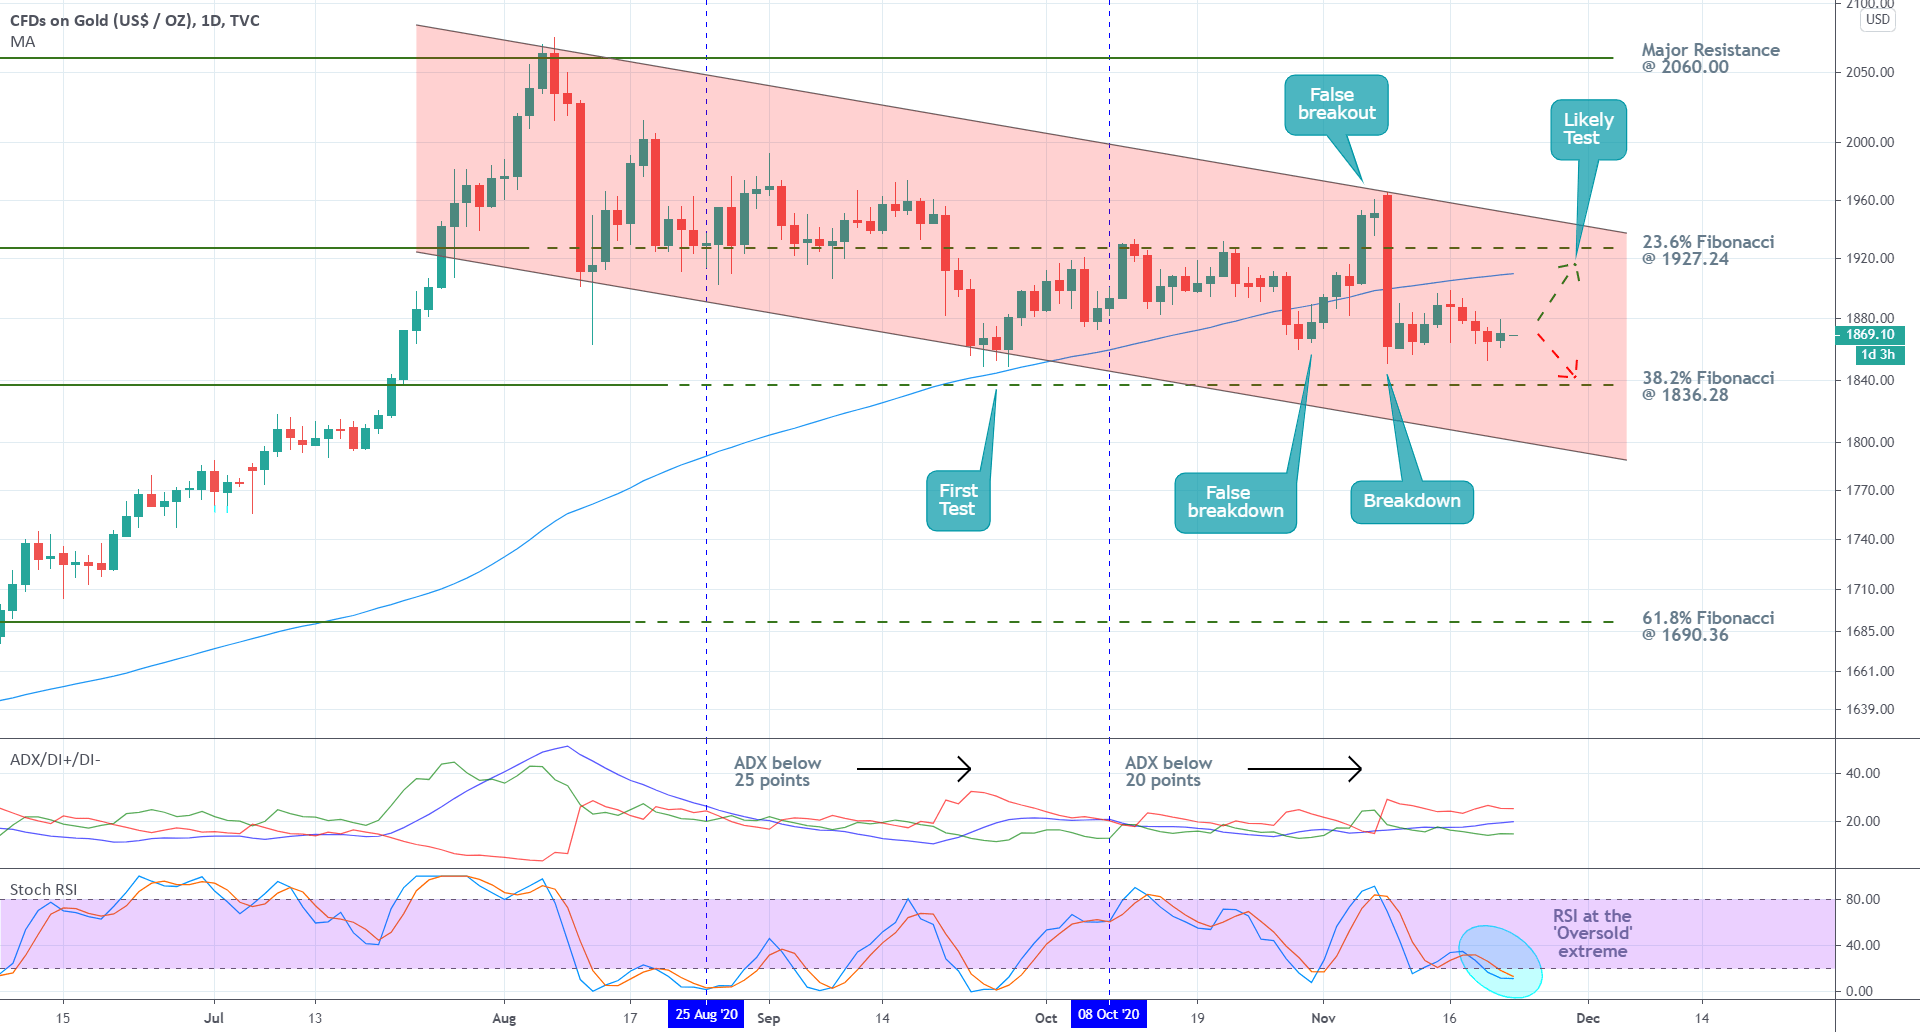
Looking at the Stochastic RSI, the indicator currently finds itself within the 'Oversold' extreme, which also surmises a likely rebound towards 1927.24, given the range-trading sentiment. This is especially evident with respect to the behaviour of the price action over the last several days. As can be seen, the corresponding candles have relatively small bodies (Doji candles) and are positioned on more or less the same plane.
All of this underscores the effect of the previously mentioned relaxation of the market, which would be accommodative to a new rebound towards the range's upper edge. If, however, more unexpected vaccine news from this week prompt an even higher level of general market excitement, the price could instead plunge towards the 38.2 per cent Fibonacci retracement level next.
2. Short-Term Outlook
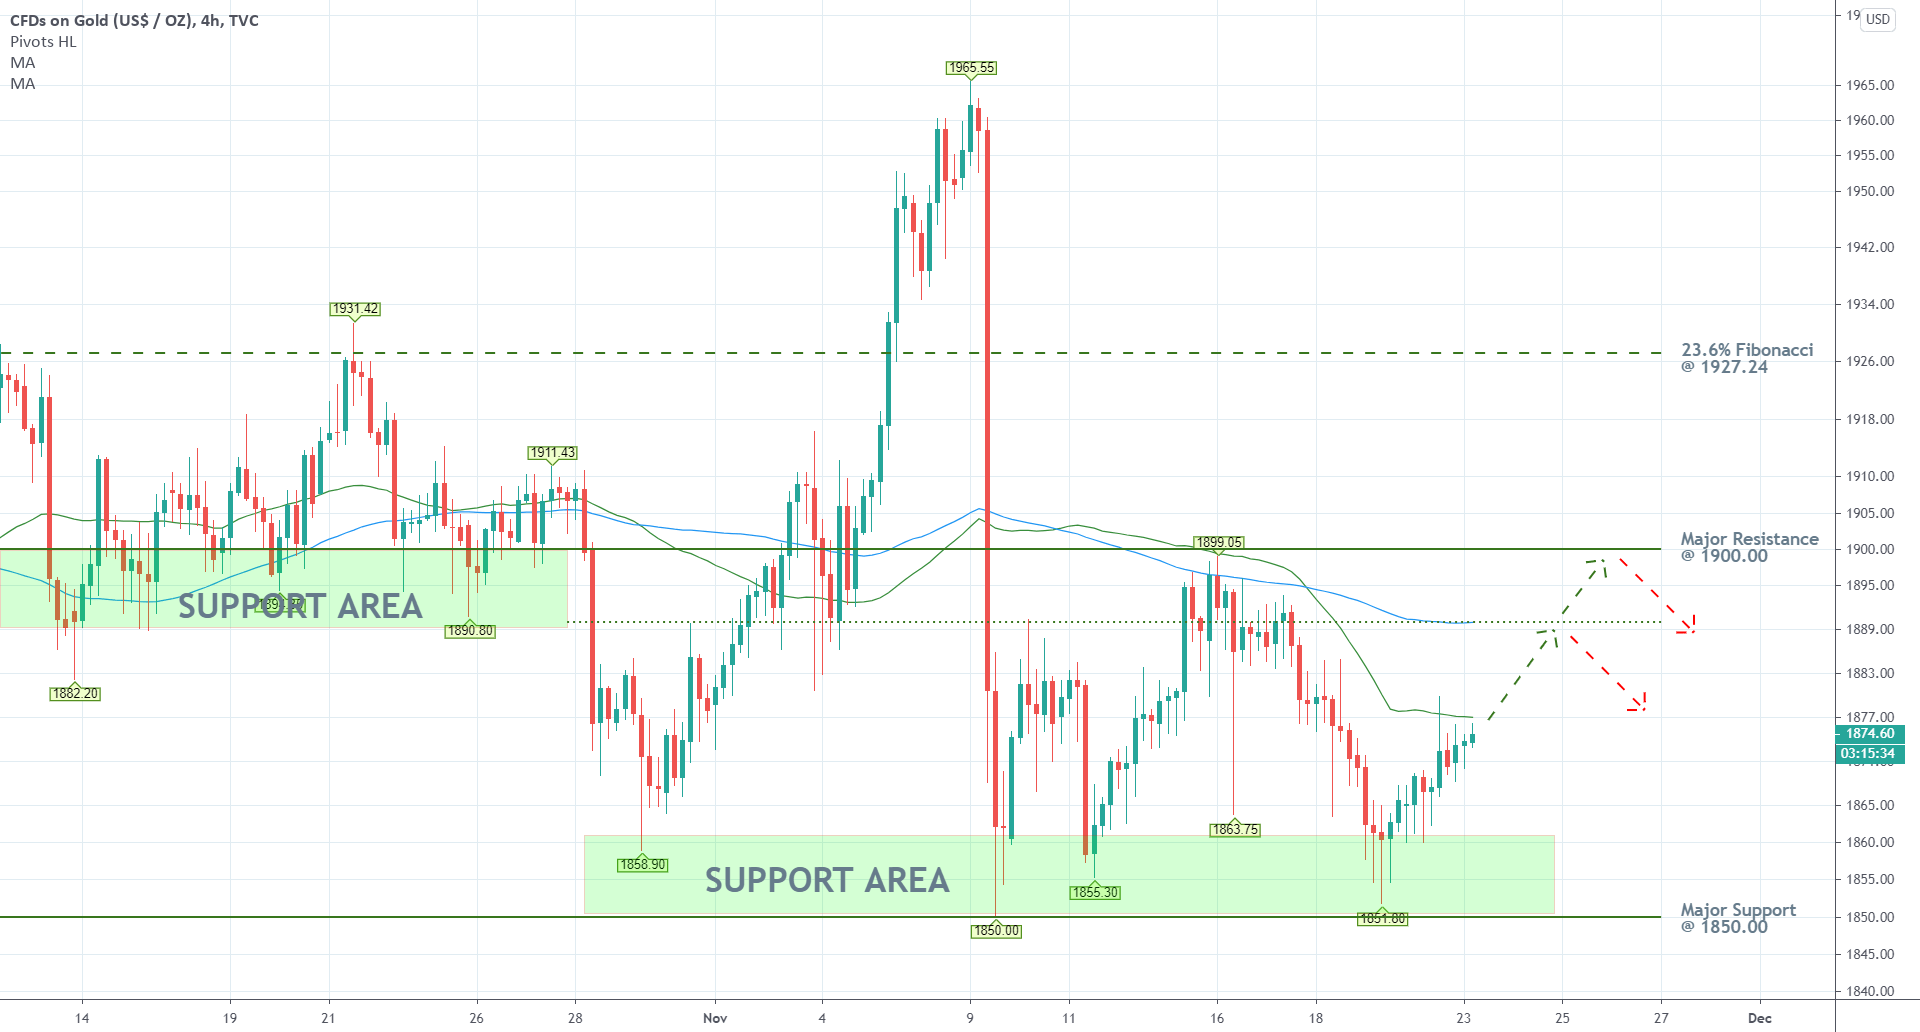
The 4H chart below outlines an even more consolidated range that exists within the broader one, which was demonstrated on the daily chart. This consolidated range spans between the major resistance at 1900.00, which bears psychological significance as a potential turning point, and the major support level at 1850.00. The pivot points are used to underpin the potential turning points for the price action.
At present, the price action is consolidating just below the 50-day MA (in green), but if it manages to break out above the moving average, its next target would be the resistance area just below the upper boundary of the range (1890.00 – 1900.00). The 100-day MA is currently converging with the resistance at 1890.00, which makes it an even more pronounced target level.
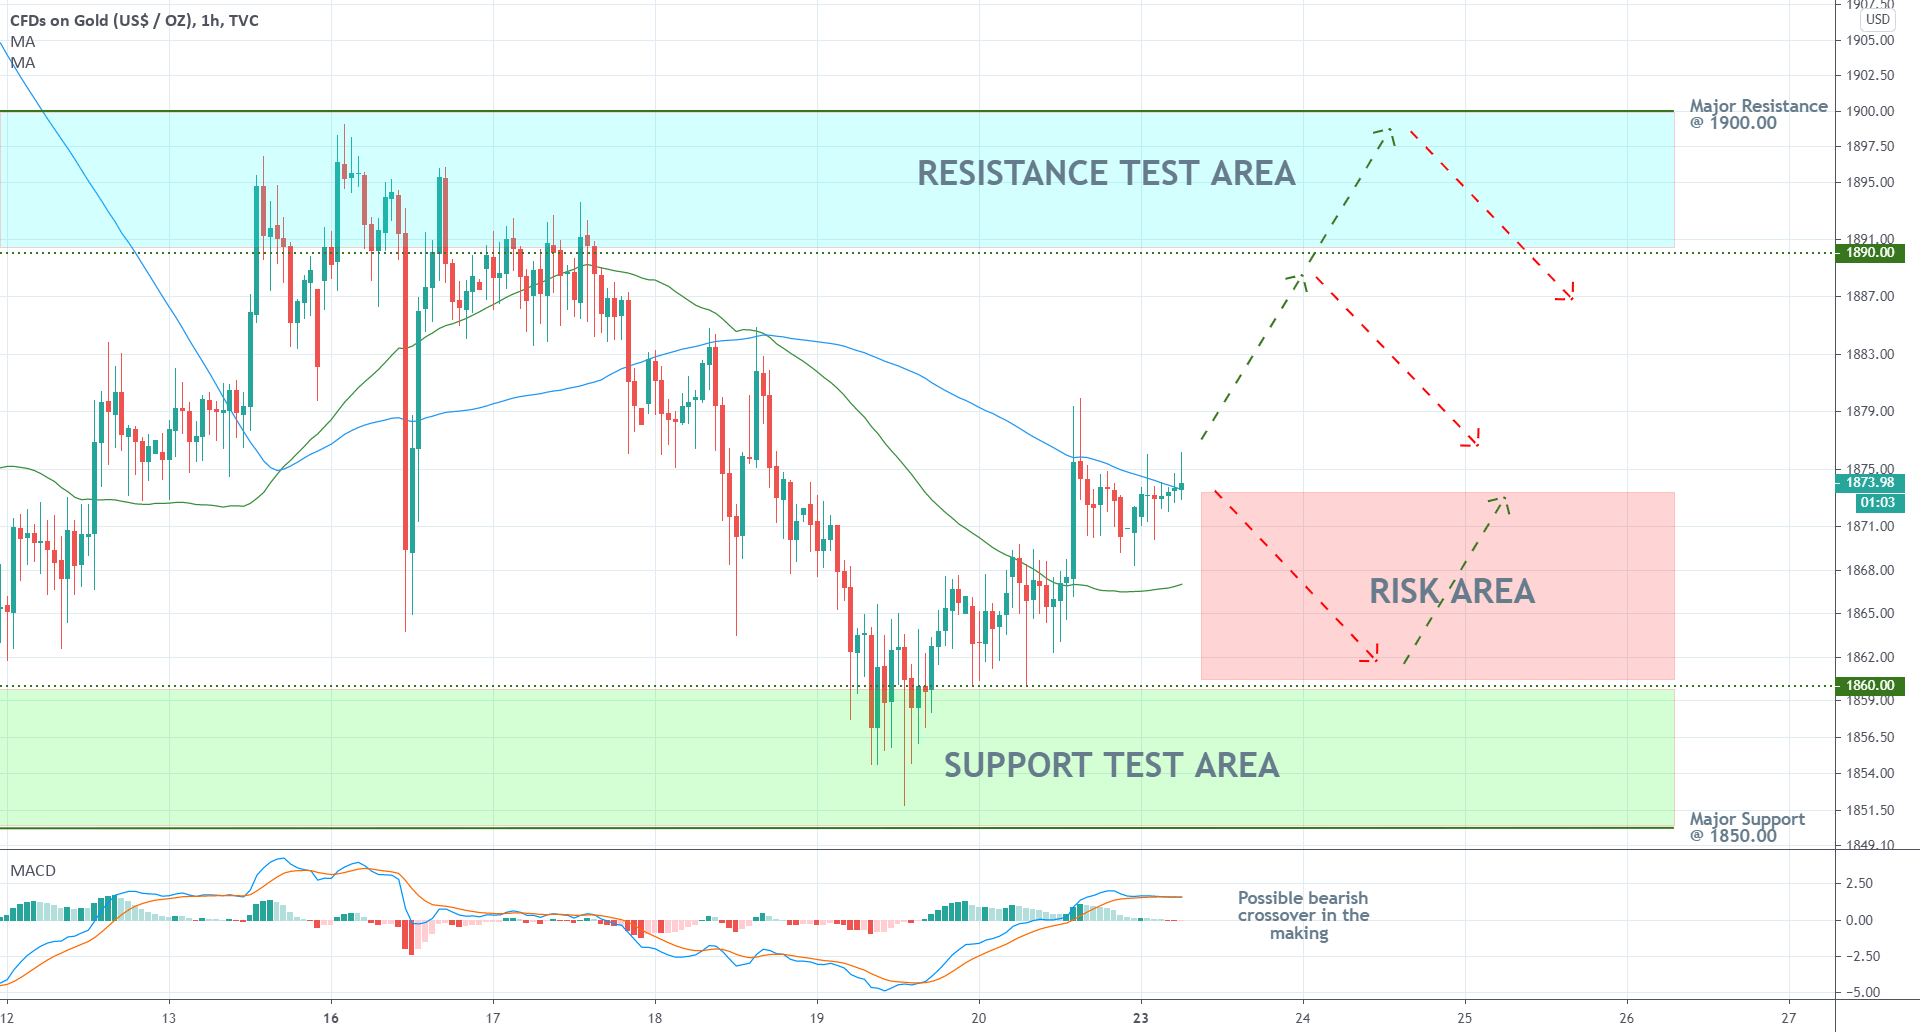
The hourly chart below demonstrates the opportunities for the implementation of range-trading strategies. On the one hand, less risk-averse traders could attempt to catch the expected upswing toward 1900.00; however, they would run the risk of sudden reversals (the Risk Area). This risk stems from the fact that the price action has already gained significant ground from the Support Test Area (lower band of the range), which means that opening any positions around the current market price would entail entering the range at its middle part.
In contrast, more risk-averse traders could wait for the price to reach one of the consolidation range's two extremes yet again, before they place any contrarian trades. This would entail selling around 1900.00, provided that there are indications that the price would not be able to break out further north or buying between 1850.00 and 1860.00.
As regards the very short-term, the behaviour of the price action around the 100-day MA (in blue) on the hourly chart would demonstrate whether or not the price would head towards the upper border of the consolidation range. Accordingly, a bearish crossover of the MACD indicator would underpin the potential for another reversal towards the range's lower edge.
3. Concluding Remarks
The comparatively subdued fundamentals, coupled with the range-trading environment, would likely support the continuation of the recent upswing further north. However, traders need to be cautious because even though the price action is still concentrated close to the lower boundary of the broader range, it is also positioned near the middle of the smaller consolidation range. This means that entries around the current market price could entail a higher degree of risk. Trade executions would depend hugely on the timescale preferences of the trader.
Author

Plamen Stoyanov
Trendsharks
Plamen started his career on the global capital markets in 2012 when he began trading with financial derivatives.


