Gold’s major reversal to create the “handle”

Gold just closed the month and quarter and its performance on the final day of both was very encouraging for the bulls. What’s going on and what changed?
Let’s start with the big picture
-637292012520272769.png)
Gold just moved to the November 2011 high and in today’s pre-market trading it even moved above it. The volume on which gold moved up last month was relatively small, which doesn’t support the bullish case, but a confirmed breakout above the November 2011 high would be an important technical development, nonetheless.
The key word here is “confirmed”. The November 2011 high was $1,804.40, and at the moment of writing these words, gold futures are trading at $1,805.15 – that’s less than $1 above the above-mentioned high.
The way in which gold moved between 2012 and 2020 created a near-perfect cup from the cup-and-handle formation. Generally, the bigger the base, the stronger the move, and this time the base is huge. Still, the “handle” of the pattern is still missing, and it could take form of a volatile plunge. This would be in tune with how gold reacted to the first wave of coronavirus.
The breakout above the November 2011 high is far from being confirmed, and in our view it’s unlikely to be confirmed. Why?
There are multiple reasons for it, but the most precise and technical ones are gold’s likelihood to reverse its direction based on the triangle-vertex-based reversal and the long-term cyclical turning point.
-637292012891847362.png)
The resistance line, above which gold tried to break and the rising support line based on the March and June lows cross more or less in the first days of July. The triangle-vertex-based reversals have pointed to many important tops and bottoms in the recent weeks and months.
We previously wrote that the above-mentioned reversal might correspond to a bottom in gold, but as of today, it’s clear that if any reversal is to take place, it’s going to be a top, not a bottom, as gold’s most recent short-term move has been up.
Let's keep in mind that gold's long-term turning point is here (the vertical gray line on the chart below), which further emphasizes the likelihood of seeing a major turnaround right now.
-637292013447349381.png)
The reversals provided by the above-mentioned techniques are actually relatively close to each other given that this is already the first week of July, and that the second week of the month starts in just 2 trading days (the markets are closed in the U.S. this Friday).
The implications here is clear – don’t count on gold’s breakout’s success
-637292013877519759.png)
The HUI Index is once again trying to break above the 2016 high. Although it might move higher today, we doubt that it would be able to hold its gains for a long time, in light of gold’s looming reversal. Instead, another invalidation of the reversal is likely.
And silver?
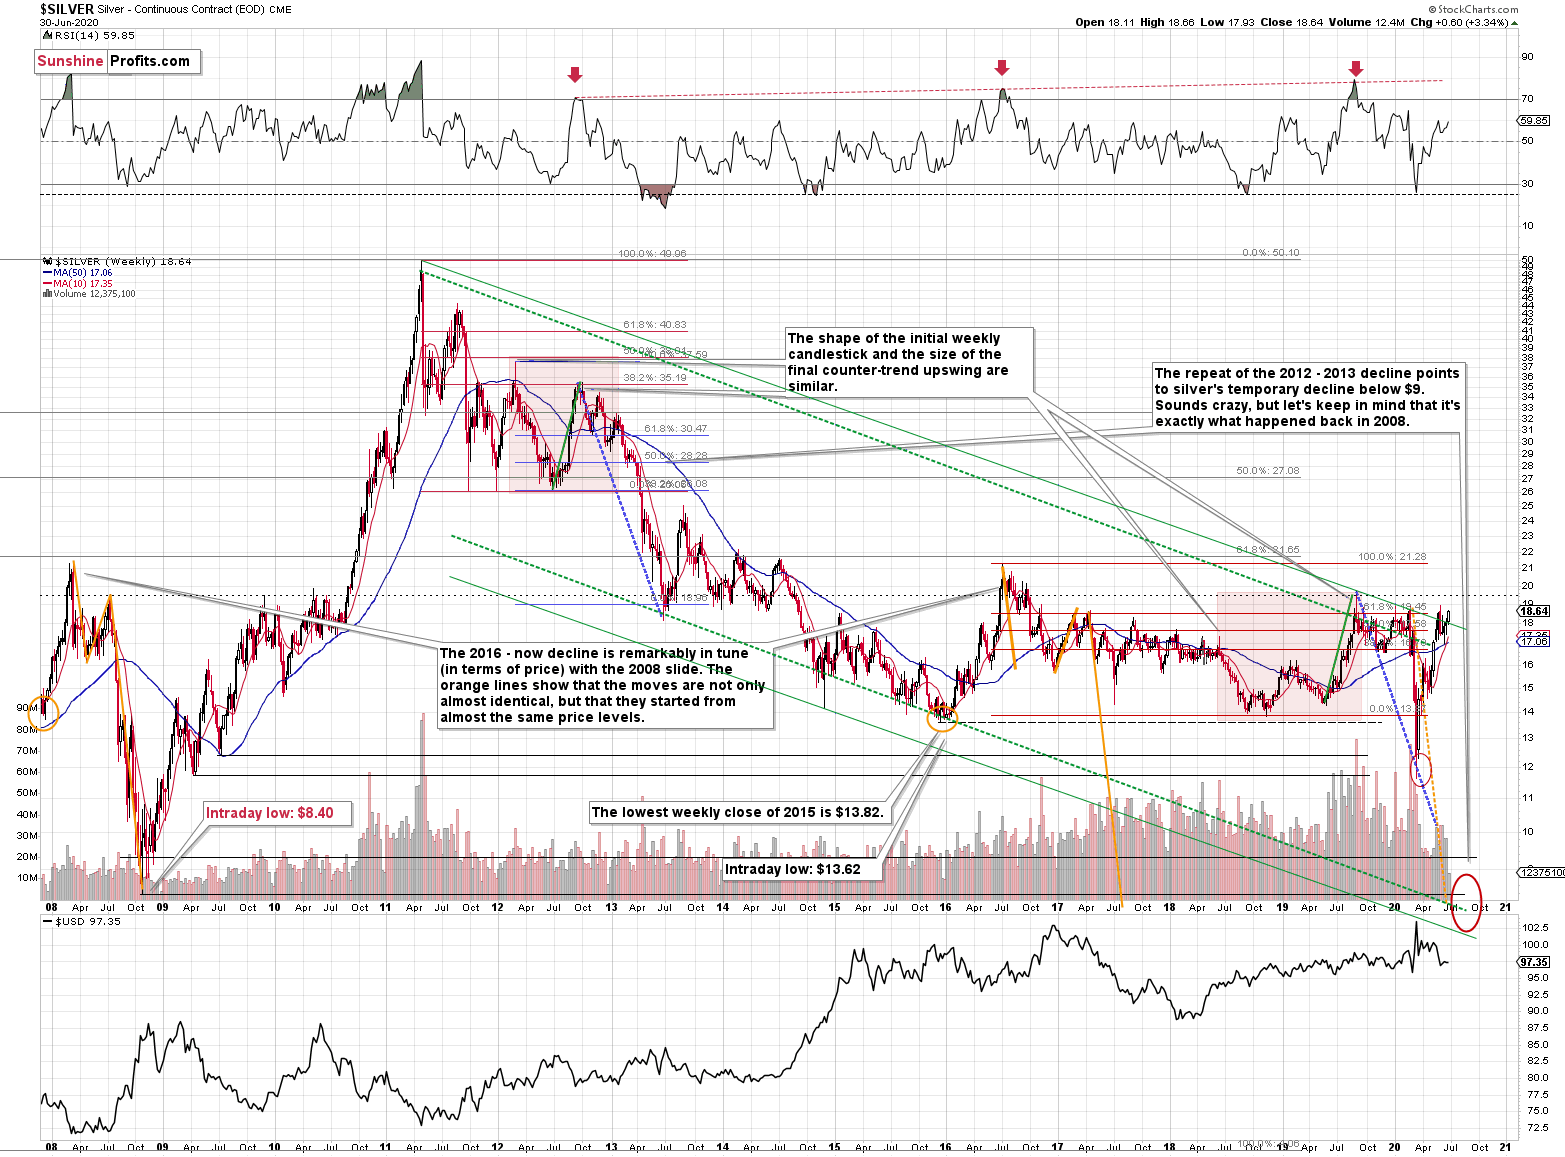
The white metal showed strength as well, rallying almost to the previous 2020 highs. As dramatic as it may sound, please note that silver just a few dollars above its 2015 low and over $30 below its 2011 high. Miners are disappointing too – it is only gold that is stealing the spotlight. And it’s doing so on relatively low volume, making its entire “strength” doubtful.
Silver broke above its declining green resistance line… Once again. This line is based on the 2011 high and the 2019 high. There were three previous attempts of the white metal to break above this line and they all failed. Is this time any different? We doubt that, especially given gold’s reversal indications.
And in particular, given the rising coronavirus cases that initially (!) triggered a precious metals sell-off in March. The sell-off started when people started really considering the economic implications of the pandemic and the lockdown, so this kind of thinking is likely to be back once the pandemic prevention mechanisms are going to be re-introduced on a bigger scale.
Summary
Summing up, gold is stealing the spotlight, trying to break above the $1,800 barrier and the November 2011 high, but it’s unlikely to be able to confirm this move. Gold did end the previous month and quarter at exceptionally high level, but the monthly volume was low and it was the only part of the precious metals market that showed this kind of strength. Silver is just a few dollars above its 2015 low and over $30 below its 2011 high, while miners are trying to get above their 2016 high – well below their 2011 high. Given the above and gold’s looming reversals, I think that a big decline is in the cards for the entire precious metals sector.
Want free follow-ups to the above article and details not available to 99%+ investors? Sign up to our free newsletter today!
Want free follow-ups to the above article and details not available to 99%+ investors? Sign up to our free newsletter today!
Author

Przemyslaw Radomski, CFA
Sunshine Profits
Przemyslaw Radomski, CFA (PR) is a precious metals investor and analyst who takes advantage of the emotionality on the markets, and invites you to do the same. His company, Sunshine Profits, publishes analytical software that any


