Gold’s and Gold stocks’ loud silence

What a beautiful nothing! Nothing really happened on the markets on Friday, but due to the context of the previous days’ actions, it was profound.
The thing is that it was a day when markets took a breather and verified their previous moves.
Some price moves are accidental or triggered by geopolitical events. Sometimes, the markets pretty much “have to” move in a certain direction because the only rational thing to do is given the event that is happening. For instance, if a war breaks out in Europe, gold rallies. But it doesn’t mean that it’s going to stay up for long. If the rally was simply reactive and not based on a broader trend, then the rally is going to be invalidated.
Importance of verification
That’s why verification of breakouts and breakdowns are so important. That’s one of the ways to tell if a given price move was temporary or “do the markets really mean it”.
What (not) happened on Friday tells us that the markets really mean what they did recently. Let’s take a closer look, starting with junior mining stocks.

Can you see the comeback above the rising support line?
No, you can’t because the GDXJ had simply moved close to this line, and then it declined once again, ending the session pretty much unchanged.
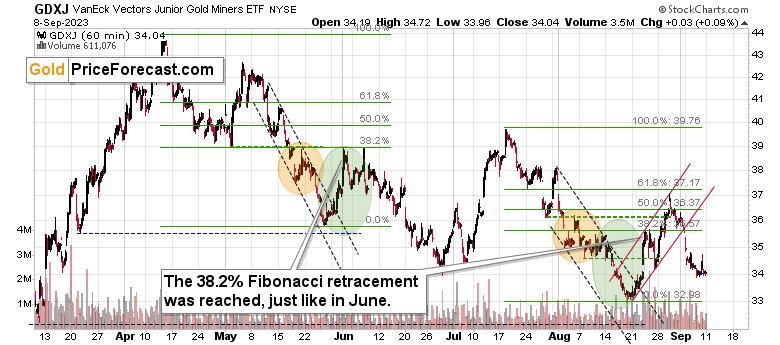
Zooming in allows us to see that junior miners also tried to close the week back above the late-August low.
That didn’t happen, and the move below this low was just confirmed – even in terms of weekly closing prices.
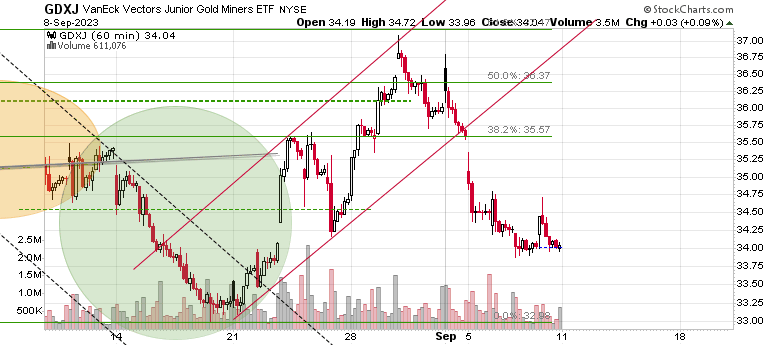
Here’s how it looks if we zoom in. The attempt to move higher was sharp, but it didn’t change anything. The breakdown was confirmed, and the implications are very bearish.
One could say that this was accidental and that junior miners – as just one market – don’t mean that much. That might have been the truth if it wasn’t for the fact that…
We saw the same kind of action in gold, silver, USD Index, and the S&P 500 index. So not only in key parts of the precious metals sector but also in the case of its key drivers. This means that our profitable position in junior mining stocks is likely to become much more profitable and that my comments from Thursday remain up-to-date:
“Interestingly, from the daily point of view (the above chart is based on the daily candlesticks), we saw a verification of the move below the rising blue support line. The GDXJ moved back to this line and then it declined once again.
This means that it’s now ready to move lower. Probably MUCH lower. Once junior miners move below their 2023 lows – and that move seems to be just around the corner – they are likely to truly plunge.
There is no significant support all the way down to the $26 - $28 area. Just as the move up from those levels was fast, the same is likely to be the case for the move lower.
The difficult part of making money on this move lower might be not to get out too early. People have tendency to let losing positions grow, while cutting the winners too early. Please keep the above note about support levels in mind, as the GDXJ slides to new yearly lows. It’s really likely to slide substantially before correcting in a meaningful manner.”
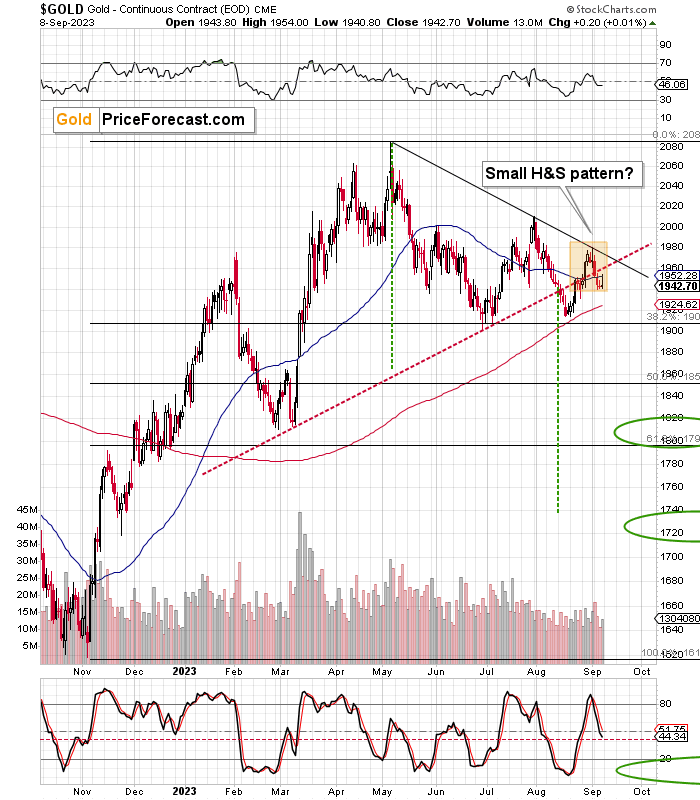
Gold price moved up and then down, just like miners did.
Gold closed the week below the rising red support line, and it seems to have formed a small head and shoulders pattern (marked with orange).
The sell signal from the Stochastic indicator (lower part of the chart) remains in place.
Implications and bearish signals
In other words, nothing bullish happened on Friday, and the intraday reversal was bearish. This brief gold price analysis points to lower gold prices in the following weeks.
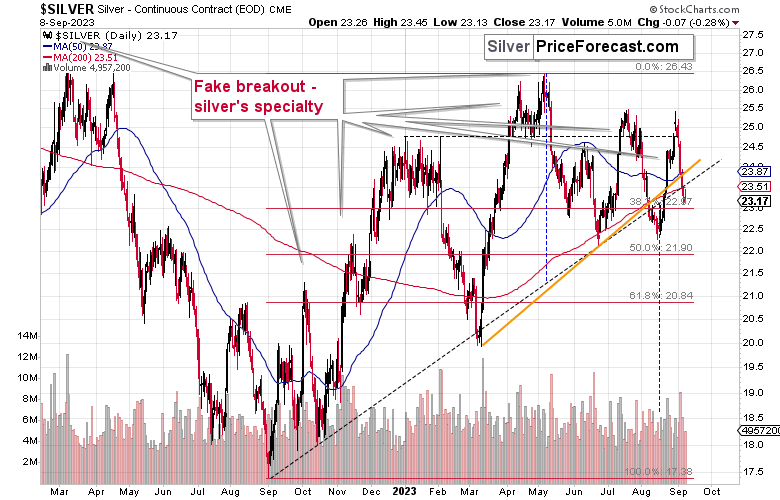
Silver price also formed an intraday reversal, and it even closed the day in the red.
Most importantly, though, silver closed the week below its rising support lines, which spells trouble for the following weeks.
This is in perfect tune with the bullish situation present in the USD Index.
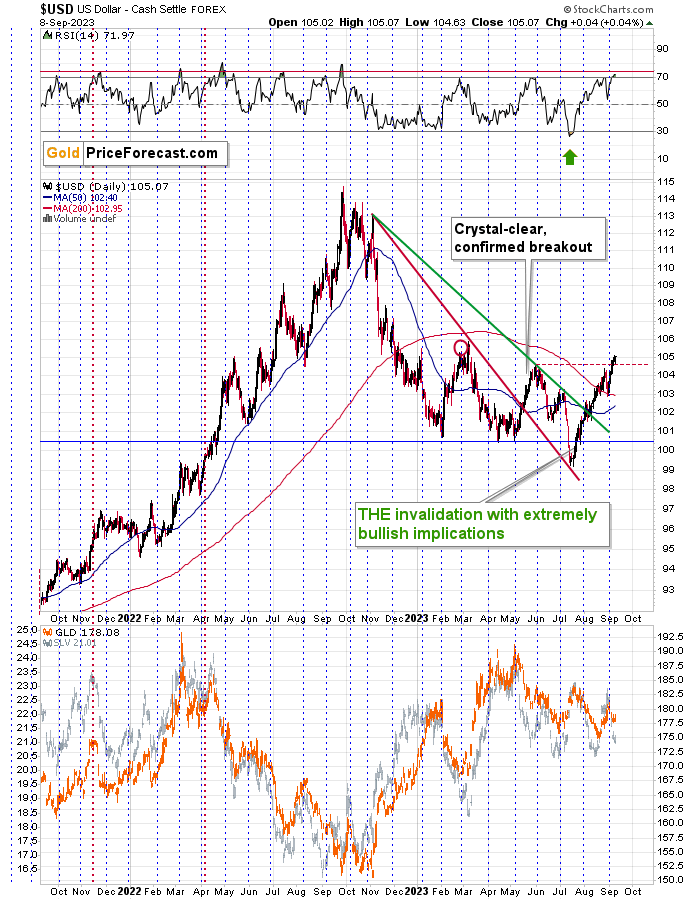
The USD Index is negatively correlated with the precious metals sector, so the bullish verification that we just saw in the USDX is a bearish factor for gold, silver, and miners.
The bullish verification arrived as yet another daily close and weekly close above the May-June highs.
Yes, the RSI is overbought, but if the medium-term trend is very strong, the USDX can rally as the RSI based on it becomes even more overbought. I marked two cases when that happened with red vertical lines: Nov. 2021 and Apr. 2022.
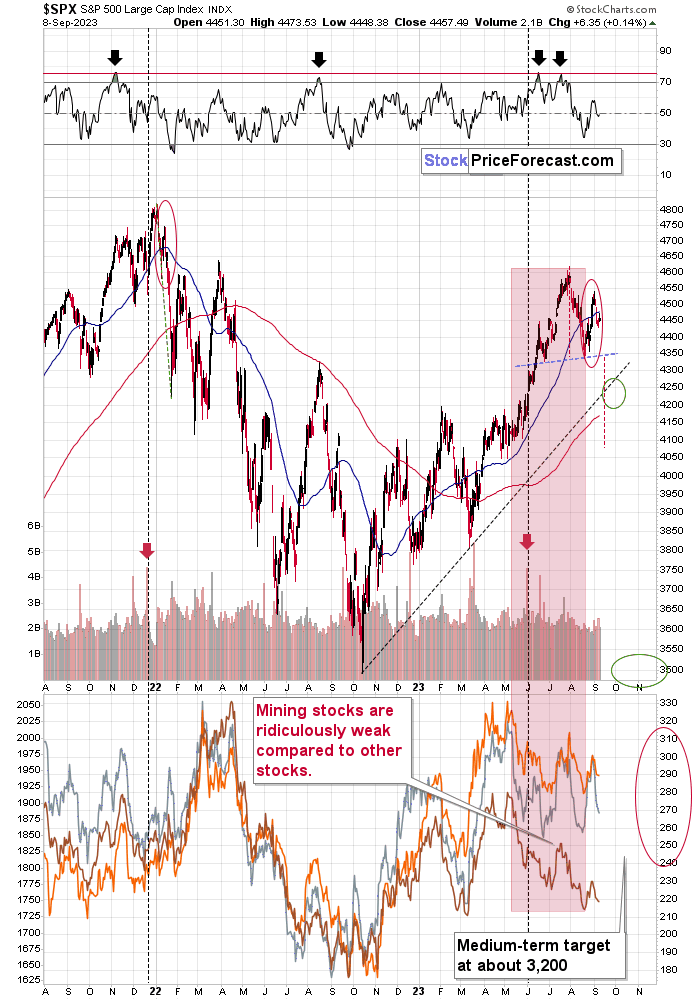
Stocks also took a breather on Friday, and their very short-term trend remains down. Once we see a breakdown below 4,350, another bigger slide is about to take place due to the head-and-shoulders pattern that will have formed at that time.
The target based on the above-mentioned H&S pattern would be at about 4,100, which is well below the rising, medium-term support line. It could be the case that we’ll see a quick move lower, below the support line, and then another move back up to the rising support line, which would then be verified as resistance. In other words, we could see a slide to about 4,100, then a rally to about 4,250, and then another sizable decline.
Of course, that’s just one of the possibilities, and whether the situation develops exactly like that doesn’t even matter that much because stocks are so overvalued compared to their fundamental situation (the interest rates are after a series of hikes, remember?) that they are likely to slide in one way or another. And they are likely to put enormous bearish pressure on the prices of mining stocks (especially junior mining stocks) – perhaps even similar to what we saw in 2008 when the carnage unfolded.
What does it all mean? It means that the precious metals market is likely to slide, quite likely profoundly so, and junior mining stocks’ prices are likely to truly slide. While I can’t promise any specific rate of return, it seems to me that the profits on this decline are going to become astronomical.
Want free follow-ups to the above article and details not available to 99%+ investors? Sign up to our free newsletter today!
Want free follow-ups to the above article and details not available to 99%+ investors? Sign up to our free newsletter today!
Author

Przemyslaw Radomski, CFA
Sunshine Profits
Przemyslaw Radomski, CFA (PR) is a precious metals investor and analyst who takes advantage of the emotionality on the markets, and invites you to do the same. His company, Sunshine Profits, publishes analytical software that any


