Gold: Volume reversal at the lows shifts the picture — $4,242 Is the breakout trigger as FOMC week arrives

1. Macro and fundamental backdrop
May CPI came in at 4.2% year on year — the highest reading since April 2023 and up from 3.8% in April. On the surface that is a bearish headline for gold. The detail tells a different story. Energy accounted for over 60% of the monthly increase, with gasoline up 40.5% year on year and fuel oil up 58.9%. Core CPI rose just 0.2% monthly — below the 0.3% estimate and sharply lower than April's 0.4%. Strip out the Iran conflict's energy shock and the underlying inflation picture is softening, not accelerating. Bond markets read that clearly: Treasury yields were largely flat after the release despite a three-year CPI high.
Goldman Sachs removed all 2026 rate cut forecasts following the data. The CME FedWatch tool shows a 97% probability of a hold at the June 16 to 17 meeting, but 70% odds of at least one rate hike by December. Warsh's first FOMC is not expected to produce a rate move — it is expected to produce a dot plot that tells markets how seriously the committee is weighing a hike in the second half of 2026.
US and Iran
Trump warned Wednesday that Iran will pay the price for not accepting the peace proposal — that statement landed the same morning as the CPI release and contributed to the Wednesday selloff. No ceasefire extension has been signed. The Strait of Hormuz remains the inflation engine, and any escalation from here adds directly to the energy component that drove CPI to 4.2%.
Central bank demand
China has added to reserves for 18 consecutive months. Net purchases in Q1 2026 came in at 244 tonnes, followed by another 17 tonnes in April per the World Gold Council. That accumulation did not prevent the 25% drawdown from the January high — but it is the reason the floor has held repeatedly at structurally significant Fibonacci levels rather than collapsing further.
The macro environment is conflicted in a way it has not been all year. Hot headline inflation argues for a hawkish Fed. Softening core argues against one. An unresolved geopolitical conflict is the source of both. Warsh's dot plot on June 17 is the clearest signal yet of where this resolves.
2. Technical structure — 4H primary timeframe
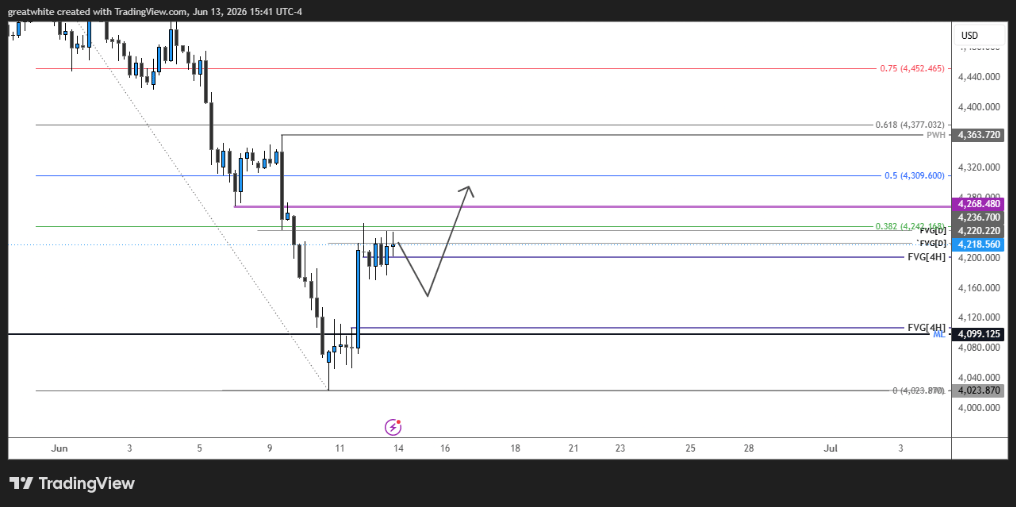
Gold is compressing $23.61 below a breakout trigger, having printed the strongest reversal signal of the entire six-week selloff. The structure is cautiously shifting. Nothing is confirmed until $4,242 closes on the daily.
The week produced five consecutive lower lows before the reversal. Wednesday's CPI release triggered a $169 flush on 1.24 million volume — textbook capitulation behaviour. What happened next is what matters. Thursday printed the low at $4,023.87 and reversed $196 on 1.30 million volume. The reversal session's volume exceeded the capitulation session's volume. That sequence is important. When buyers absorb a capitulation flush on higher volume than the flush itself produced, it signals that institutional demand entered at those lows with more size than the sellers had available. This is not a technical bounce. It is absorption, and it carries the same analytical weight as the SSL sweeps discussed in the April and May outlooks — but with one critical difference: those sweeps reversed at supply-side liquidity pools. This reversal came at the confluence of the 61.8% Fibonacci retracement of the full 4,099.12 to 4,891.54 structural swing (4,401.82, hit weeks earlier) and the 200 day EMA at 4,377.15, both of which had been structural targets since the May 17 outlook. The market found its floor exactly where the analysis said to look.
Friday confirmed the reversal with a higher low at $4,170 versus Thursday's $4,024 — the first higher low in three weeks, on 985k volume that remained above the five session average. The weekly candle closed as a hammer with a $298 lower wick. These are sequential confirmation signals, not coincidences. The bias has shifted to cautiously bullish. The word cautiously is doing real work — FOMC week with a hawkish incoming Chair and 70% odds of a year-end rate hike is not an environment for aggressive long positioning.
The Fibonacci range has been reanchored from the new structural low at $4,023.87 to the prior swing high at $4,595.33. This produces the key levels for the coming week: the 0.382 retracement at $4,242.17 is the breakout trigger, the 0.500 at $4,309.60 is the first target, and the 0.618 at $4,377.03 is the second. All three sit in sequence above current price.
Market structure summary:
- Five consecutive lower lows ended at $4,023.87 — the 61.8% fib and 200 day EMA confluence held
- Capitulation on 1.24M volume Wednesday; reversal on 1.30M volume Thursday — buyers exceeded sellers at the low
- First higher low confirmed Friday at $4,170 — six-session losing streak broken
- Weekly hammer with $298 lower wick — strongest bottoming signal of the selloff
- Breakout trigger: 4H close above $4,242.17 (0.382 fib) with volume above 80k
- Invalidation: Daily close below $4,023.87 — recovery reclassified as a corrective bounce
Level | Type | Significance |
4,595.33 | Prior Swing High — Extended Target | Full recovery objective. A sustained close above $4,473 opens the path toward this level. Not relevant until structure above $4,377 is confirmed. |
4,473.04 | 0.786 Fibonacci — Upper Resistance | Deep retracement level within the recovery swing. Supply zone for any extended continuation beyond $4,377. |
4,377.03 | 0.618 Fibonacci — Secondary Target | Second bullish continuation target and the 0.618 retracement of the full $4,023.87 to $4,595.33 swing. Coincides with the prior monthly low zone. |
4,366.23 | Prior Monthly Low — Resistance | Structural floor from April and May, broken on June 5. Now supply. A close above this level confirms the recovery has legs beyond a technical bounce. |
4,309.60 | 0.500 Fibonacci — Primary Target | Midpoint of the $4,023.87 to $4,595.33 swing. First clean upside objective once $4,242 is broken and accepted. |
4,242.17 | 0.382 Fibonacci — Breakout Trigger | The level that decides the week. A 4H close above this with volume confirms buyers have absorbed the selloff and the structure is shifting. |
4,218.56 | Current Price — Friday Close | Sitting $23.61 below the breakout trigger. Price is compressing between the higher low at $4,170 and the $4,242 decision level. |
4,195.00 | Pullback Entry Zone — Upper | First reference for a reactive long entry on any dip before the breakout. A hold here with a bullish reversal candle on the 4H is a valid long setup. |
4,185.00 | Pullback Entry Zone — Lower | Floor of the reactive long entry zone. A daily close below this level without recovery signals the bounce is losing conviction. |
4,170.00 | Friday Low — Structural Support | The first higher low of the current recovery sequence. Must hold on any pullback to keep the cautiously bullish structure intact. |
4,023.87 | Thursday Low — Structural Base and Invalidation | The low of the capitulation sequence. A daily close below this level invalidates the current recovery and reopens $3,950. |
3,950.00 | Extended Bearish Target | Next significant reference below $4,024 on confirmed structural failure. Activated only on a sustained close below $4,023.87. |
3. Key zone analysis
The zone that defines the week is the $4,242.17 level — the 0.382 Fibonacci retracement of the $4,023.87 to $4,595.33 swing. Price is $23.61 below it at the time of writing. A 4H close above $4,242 on volume above 80k is the confirmation signal that the absorption at the lows has translated into genuine buying pressure rather than a dead-cat bounce. Without that close, the cautious qualifier on the bullish bias remains fully in effect.
The pullback entry zone between $4,185 and $4,195 is the reactive long alternative. If price dips from current levels without breaking $4,170, a hold in that band with a bullish 4H reversal candle provides a higher probability entry than chasing a breakout. The target sequence is the same either way: $4,310 then $4,377.
Below current price, $4,170 is the line that must hold. It is Friday's low and the first higher low of the recovery. A 1H close below it flips the structure back to bearish and opens a retest of $4,023.87. The character of any break matters — a fast, high-volume break is more structurally damaging than a slow grind; the latter can still recover.
4. Scenario based trade framework
Scenario 1 — Bullish continuation (primary bias — cautious)
Two valid entry paths exist within this scenario. Either is acceptable; neither should be anticipated before the condition is met.
Path A — Breakout: A 4H close above $4,242.17 confirms buyers are in control. Enter on the retest of $4,242 from above, or on the break continuation if volume sustains.
Path B — Pullback: Price dips to the $4,185 to $4,195 zone, holds, and prints a bullish 4H reversal candle. Enter on confirmation of that candle close.
- T1: $4,309.60 — 0.500 Fibonacci retracement; first clean resistance above the breakout trigger
- T2: $4,377.03 — 0.618 Fibonacci retracement; coincides with the prior monthly low zone from May analysis
- Stop: Below $4,170 on the breakout entry. Below $4,155 on the pullback entry.
- Note: Position sizing should account for FOMC on June 17. The dot plot introduces binary risk regardless of technical setup.
Scenario 2 — Bearish resumption (reactive)
Trigger: A 1H close below $4,170 — Friday's low and the structural anchor of the current higher low sequence.
Expected path: $4,170 lost → retest of $4,023.87 → $3,950 on confirmed daily close below $4,024
- Execution: Short on a confirmed 1H close below $4,170. No anticipatory shorts above that level.
- T1: $4,023.87 — retest of Thursday's low and the structural base
- T2: $3,950 — extended target on a daily close below $4,024 with bearish expansion
- Stop: Above $4,200 — a recovery back above that level signals the break was a wick, not a structural loss.
Scenario 3 — Extended structural recovery (conditional on FOMC)
Trigger: A daily close above $4,377.03 (0.618 fib) following a confirmed FOMC hold with language that does not formally reintroduce rate hike guidance. This combination — technical acceptance above $4,377 and a dovish hold — would materially strengthen the structural recovery thesis.
Expected path: $4,377 acceptance → $4,473.04 (0.786 fib) → reassessment toward $4,595.33 (prior swing high)
- Entry logic: Do not enter on the initial close above $4,377. Wait for a retest of that level on the 4H that holds and produces a bullish confirmation candle — evidence the prior resistance has converted to demand.
- T1: $4,473.04 — 0.786 Fibonacci retracement; upper supply zone within the recovery swing
- T2: $4,595.33 — the prior swing high and the top of the reanchored Fibonacci range
- Stop: Below $4,340 on the retest entry. A close back below that level signals the $4,377 break was rejected and supply is still active.
- Probability: Conditional. The volume absorption at $4,024 is the strongest bottoming signal since the selloff began. But Warsh's dot plot on June 17 is the variable that cannot be modelled. If the committee signals two hikes in 2026 and the dot plot moves materially hawkish, this scenario is delayed regardless of the technical setup. Weight it at 25 to 30% probability entering the week — rising to 50%+ on a neutral to dovish FOMC outcome.
5. Risk events and catalysts — Week of 16 June 2026
June 16 to 17 — FOMC Meeting and dot plot (Warsh)
The week's defining event. No rate move is expected — 97% probability of a hold. The dot plot is what matters: if the median projection shifts to show two hikes in 2026, the dollar firms, yields rise, and gold's recovery stalls or reverses. A neutral to dovish dot plot — holding current projections or softening them — removes the primary headwind and accelerates Scenario 3.
June 17 — Warsh Press conference
Warsh's first public statement as Chair will be parsed for tone more than content. A measured, data dependent framing is neutral to positive for gold. Explicit hawkish language about the second half of 2026 is the risk. His track record argues for the latter, but the core CPI softening this week gives him room to be more balanced than the headline suggests.
US and Iran (ongoing)
Trump's warning to Iran on June 10 has not produced a formal response. Any military escalation spikes oil, drives CPI expectations higher, and complicates the FOMC statement — ambiguous for gold in the near term but structurally bearish for rate expectations. A peace framework being signed before June 17 would be unambiguously positive for risk assets and would relieve the energy inflation premium.
6. Summary and directional bias
Gold has compressed to $23.61 below the breakout trigger after printing the strongest reversal signal of the six-week selloff. The capitulation at $4,024 was absorbed by buyers on higher volume than the flush itself produced. A first higher low at $4,170 followed. The weekly candle closed as a hammer. These signals do not guarantee a bottom — they indicate that one may have formed. The confirmation is a 4H close above $4,242.17.
The FOMC on June 17 is the variable that overrides everything technical this week. Position sizing and stop placement matter more than usual. The base case is cautiously bullish above $4,170, with the breakout at $4,242 as the key trigger and $4,024 as the structural line that ends the recovery thesis if lost.
BULLISH ABOVE | NEUTRAL BETWEEN | BEARISH BELOW |
4,242.17 Breakout confirmed; targets 4,310 → 4,377 | 4,170 – 4,242 Compression zone; await directional close | 4,170.00 Higher low lost; bearish resumption toward 4,024 |
Author

Martin Nwankwo
TradingPRO
Technical Market analyst with over a decade of forex experience, an ICT chartered student.


