Gold unexpectedly collapsed – How low can Gold go this week? [Video]
![Gold unexpectedly collapsed – How low can Gold go this week? [Video]](https://editorial.fxstreet.com/images/Markets/Commodities/Metals/Gold/gold-gm187363896-28836378_XtraLarge.jpg)
Gold unexpectedly collapsed last week after making a new all time high. There was no indication from short term or the daily chart that the correction was about to occur & I do not believe it was all down to a stronger PMI number, when the dollar did not climb significantly against other currencies.
-
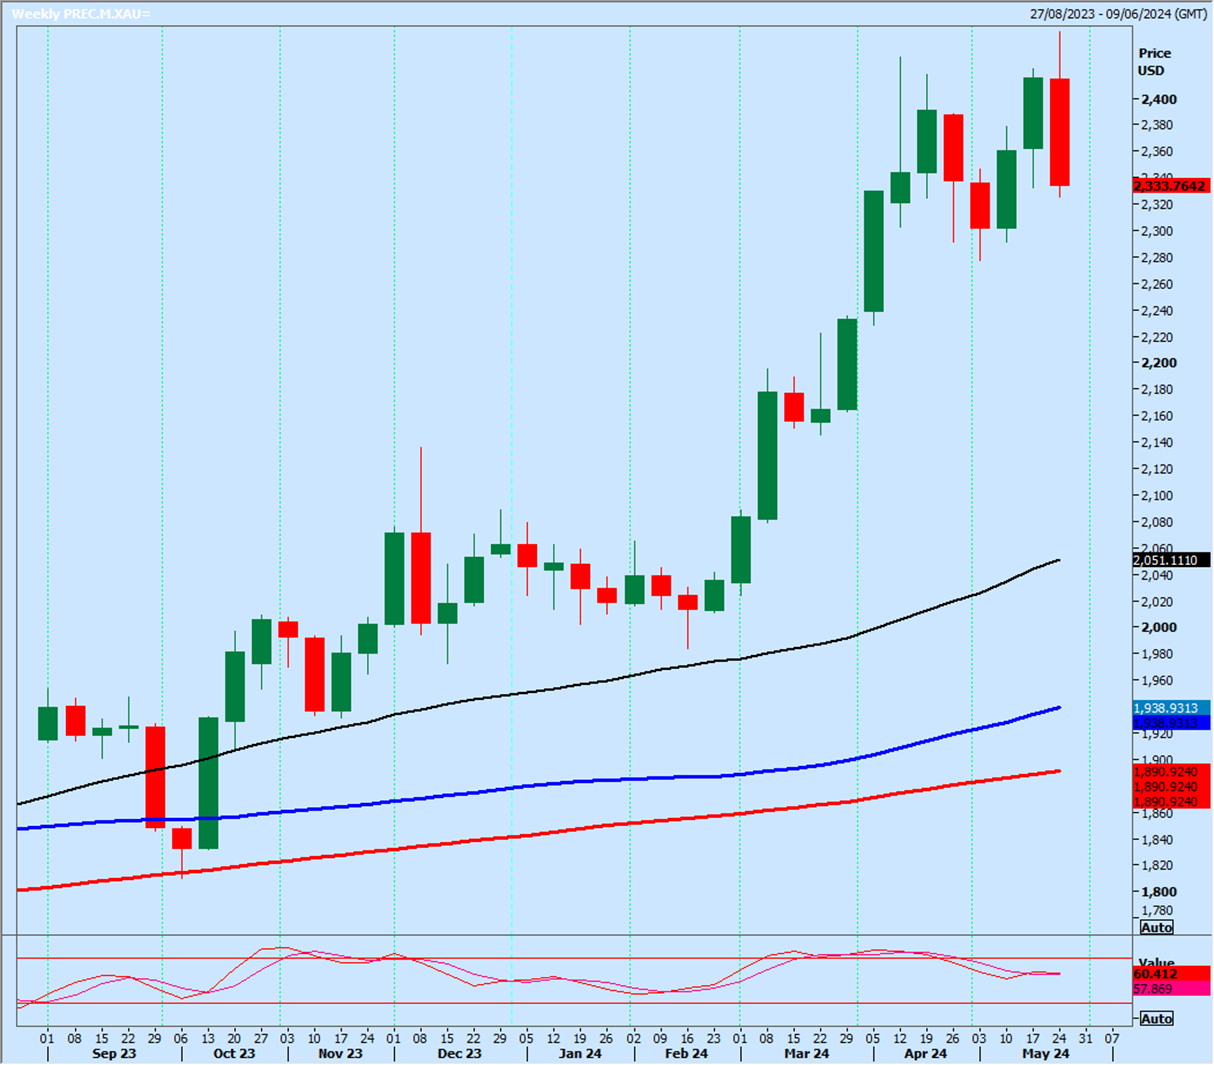
As I warned, a close last week below the previous week's low of 2332 leaves an important bearish engulfing candle on the weekly chart. (When a new all time high is reached & the price then collapses below the previous candle low, creating a bull trap, when longs are holding losing positions). Although we closed a point above 2332, it still qualifies as a bearish engulfing candle in my view. (See chart).
-
Although I will not take this as an immediate sell signal, it is a warning to bulls that the bull run may be over at this stage. It could mean we consolidate in a sideways channel, it does not necessarily mean prices are about to collapse, although I would not be surprised to see us drift lower to 2310/00 at the start of this week. I then need to see what pattern develops.
-
Just 1 thing to note, I think last week's high is too far above the April high for a double top pattern to be relevant. So it's not as negative as it could have been.
-
On Friday I thought we could see a recovery & I wrote: Gains could be limited, with nervous short term bulls trapped in some losses, so a high for the day around 2350/55 is possible.However we only made it as far as 2347.
Silver
-
Silver collapsed through my buying opportunity at 3100/3080 with stops triggered below 3050.
The break lower signalled a slide as far as a buying opportunity at 3010/3000.
This target was quickly achieved with a low for the day exactly here.
Longs need stops below 2970. -
Targets for our longs are 3055/60 & even 3095/99 is possible.
-
However a break below 2970 is a sell signal for today, targeting 2930/25, perhaps as far as strong support at 2900/2890.
Expert daily technical analysis, signals & trade ideas for Gold Silver & WTI Crude:
Author

Jason Sen
DayTradeIdeas.co.uk


