Gold run hits all-time highs: Weekly flag pattern projects long-term target at $2,900

Gold Prices Surge to Record Highs
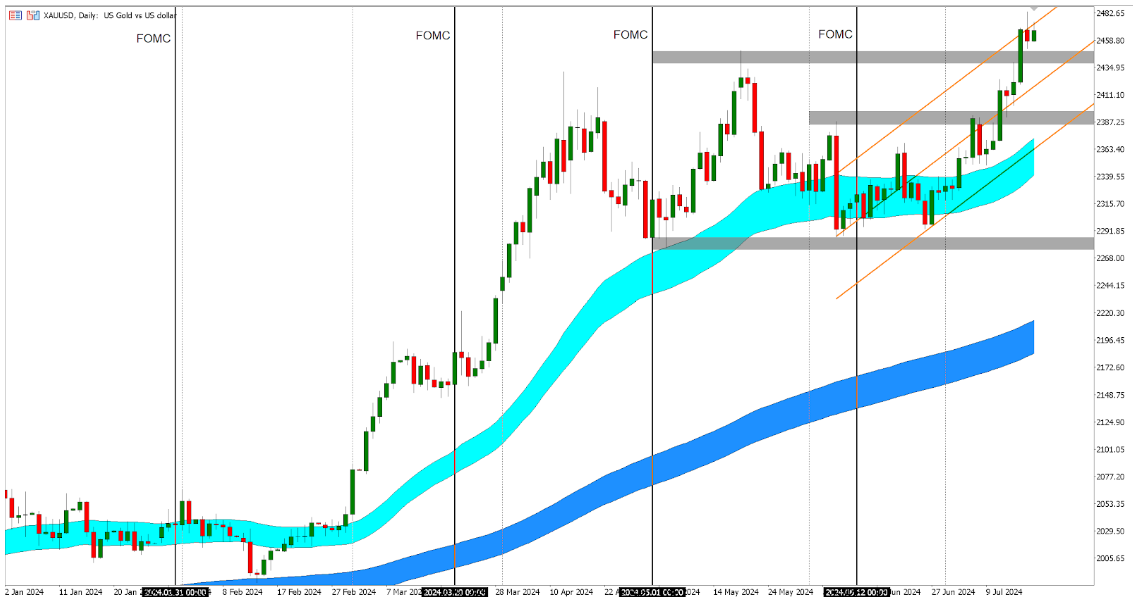
Gold prices surged to an all-time high above $2,480 per ounce on Wednesday. Since the start of 2024, gold has climbed over 20%, including an 8% rise since early June following the last FOMC meeting on June 12th.
Market Sentiment Shift
The market's expectations for Federal Reserve rate cuts have changed significantly over the past week. During the previous months, there were low expectations for multiple rate cuts this year. However, it is now perceived by the market as almost certain that there will be a rate cut in September, with one or two more possible by year-end. The CME FedWatch tool now indicates a 96% chance of at least a 0.25% cut in the Fed Funds rate in September, up from just above 60% at the start of last week. This shift followed softer-than-expected US inflation data for June, with the CPI falling to 3.0%.
Fundamental Data
Declining inflation and stalling retail sales in the U.S. have influenced market expectations. Fed Chair Jerome Powell's remarks on inflation nearing target levels have increased market confidence in an easing cycle starting in September. These factors have boosted gold's performance, with recent data pushing prices towards new highs.
Global Central Bank Actions
Expectations that other major central banks in Europe and Asia will also implement rate cuts have increased demand for precious metals. This global trend towards lower interest rates supports the bullish outlook for gold.
China's Economic Data
Weaker economic data from China, published earlier in the week, has increased global economic uncertainty and further supported gold prices. China's GDP growth slowed to 4.7% year-on-year in Q2, down from 5.3% in Q1, with other indicators like retail sales and fixed asset investment also underperforming.
China’s Gold Buying
The People's Bank of China's decision to halt gold purchases in June slightly influenced market sentiment, but overall demand from investors remains strong amid global economic uncertainties. Chinese retail investors continue to buy gold, even at high premiums, highlighting strong consumer demand in China.
Geopolitical Risks
Gold has reached new all-time highs amidst lower geopolitical risks compared to previous months when Middle East tensions were escalating. With gold currently at record prices, the emergence of any new geopolitical risks or escalating tensions could further propel prices, potentially leading to significant price discovery and parabolic increases.
Technical Overview
Gold has decisively broken out of its range, setting a new all-time high and signalling the end of its sideways consolidation phase. This breakout suggests a broader uptrend and a potential strong rally in the coming months. Technically, gold has been in an uptrend since the start of the year, with a pause in the trend from mid-April to mid-July. This pause was driven by uncertainty around potential Fed rate cuts, causing a sideways consolidation in prices. Despite potential resistance, the fundamentals strongly support further price discovery.
Long-Term Flag Pattern
The period from February to April saw an aggressive rise, followed by a three-month consolidation between $2,275 and $2,450. This earlier rise along with the consolidation period have formed a flag pattern on the weekly chart, typical of strong bull markets and indicative of a trend continuation trend. Using technical analysis, the projection from this flag pattern suggests a long-term target of $2,900, just below the psychological level of $3,000. While this target might take time to materialize, it sets the narrative for the upcoming months. Intermediate resistance is expected at $2,600.
Short-Term Momentum
While the overall trend remains strongly bullish, traders are monitoring for any support levels or short-term consolidation patterns that could trigger bullish momentum, providing opportunities to initiate new positions that follow the trend. However, an immediate break below the $2,450 level could indicate potential weakness in the current upward wave. This could signal a short-term correction as the market seeks a support level to reignite further rallies.
Potential Reversal Patterns
Only a newly formed reversal pattern below $2,450 would serve as a more serious warning, suggesting a lack of follow-through in the breakout and potentially leading to a consolidation period or deeper correction, postponing the immediate continuation of the rally. Short-term support levels to watch are $2,430 and $2,400, with a further break below $2,400 shifting medium-term momentum to bearish. Such a shift in momentum would be more significant if accompanied by the emergence of bearish news or if expectations for a Federal Reserve rate cut shift unexpectedly. Market participants should closely monitor these levels and news developments for potential changes in market direction.
Gold daily chart
Author

Marios Pashardes
FXGT.com
Marios Pashardes is a seasoned market analyst and trading educator with over 14 years of experience providing comprehensive market insights across forex, commodities, stocks, and cryptocurrency markets.


