Gold rotates back under 5,000 as the post-breakout digestion unfolds

Gold briefly expanded into the new long-term phase before rotating back below 5,000, shifting focus to how price responds within the lower structure.
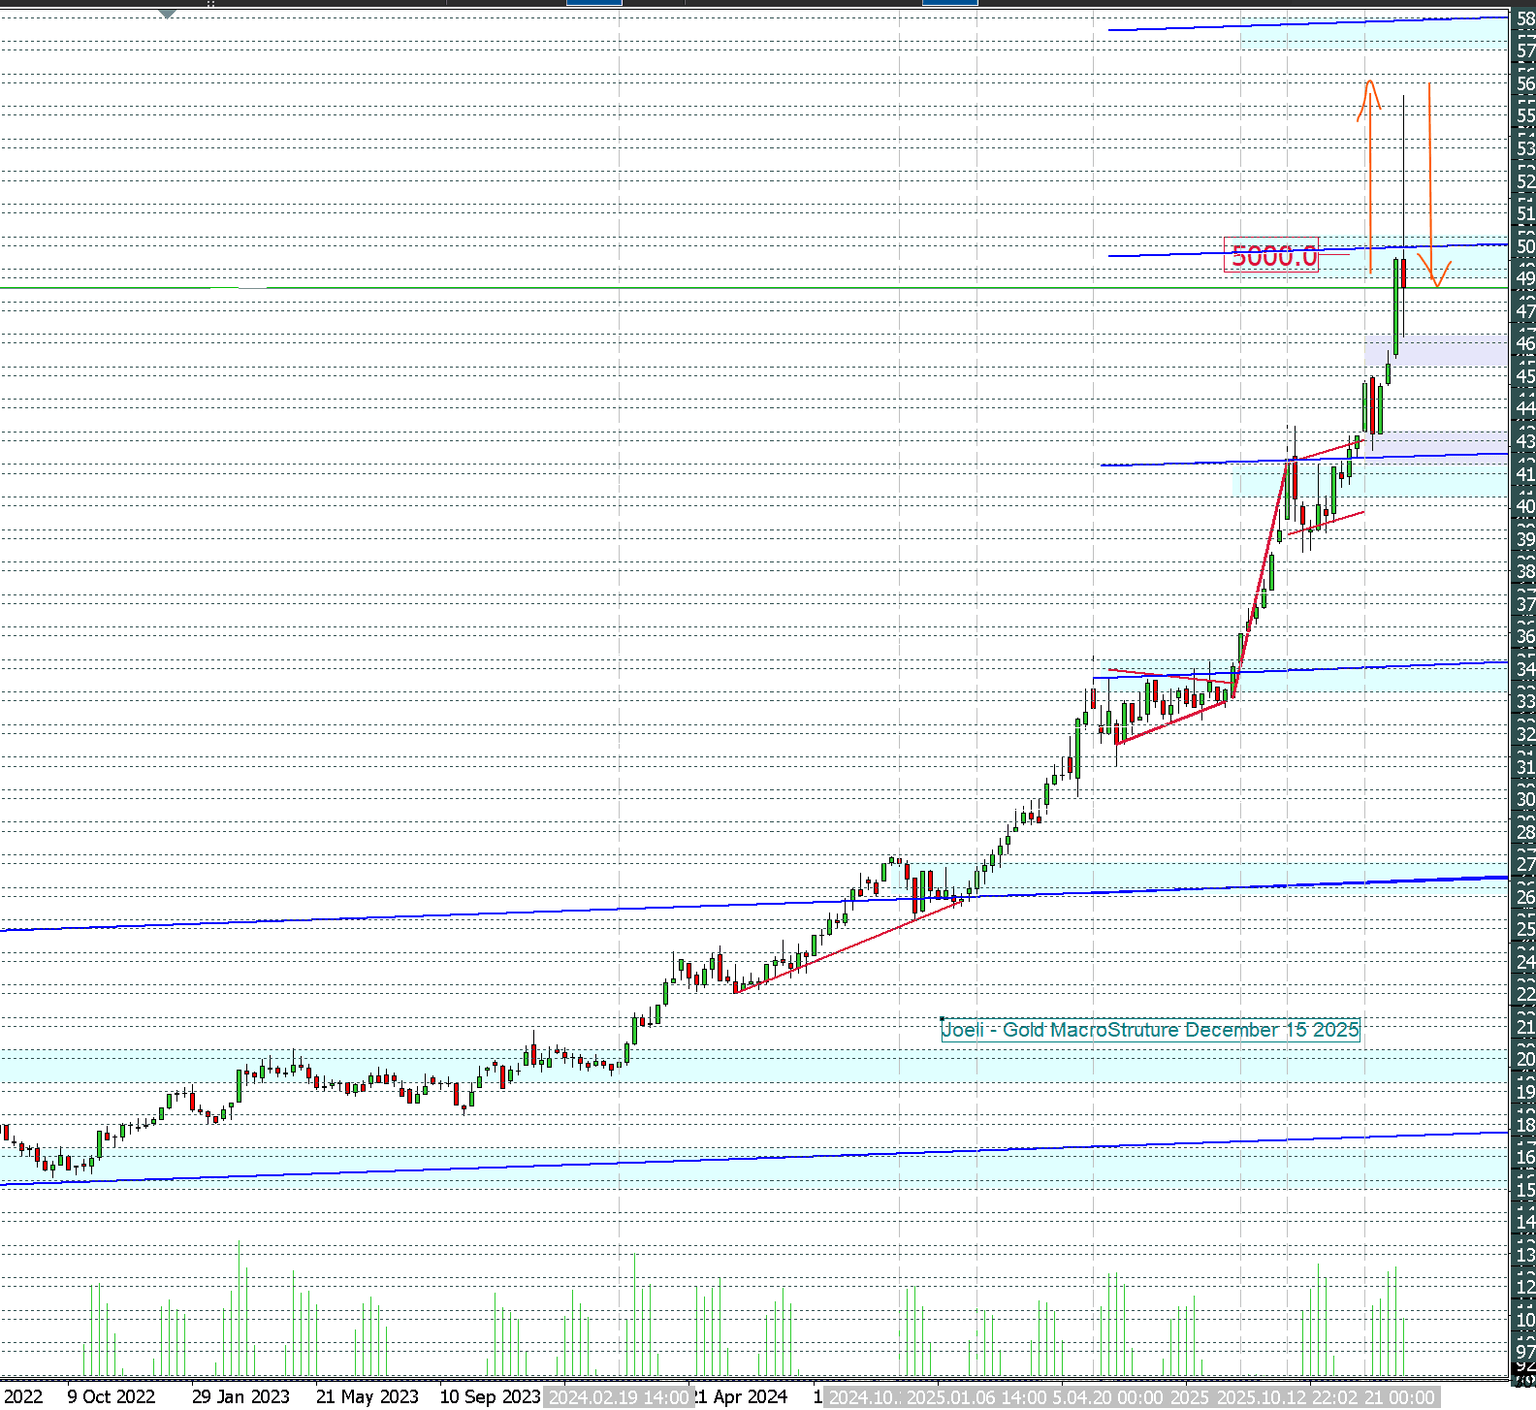
Gold prices have rotated lower following a historic breakout above the 5,000 level, as the market digests one of its strongest upside expansions in more than a decade. While the pullback has been sharp, the broader structural framework remains intact, with current price action reflecting rotation within a long-term two-way structure, rather than a breakdown.
This update continues an ongoing structural log initiated in December 2025, tracking how Gold progresses through defined phases across both long-term and short-term timeframes. The objective remains to document how price responds within structure, not to anticipate directional outcomes.
Expansion phase completes above 5,000
The move through 5,000 marked the completion of a major expansion phase in Gold. That breakout delivered the largest weekly rally in more than a decade, with price accelerating rapidly through multiple internal macro reference zones at 5,186, 5,274, 5,390, and 5,512.
Gold briefly expanded above 5,000 into the new long-term phase before rotating back below the level, as the market absorbed the move. Similar behaviour has followed prior phase completions throughout Gold’s historical cycles, where strong directional advances are often followed by consolidation or rotation as participation resets.
As outlined in the previous report, the historical expansion phase appears to be in its later stages, with price now transitioning back toward the broader structural framework rather than extending further.
Weekly structure rotates lower, framework unchanged
Following the expansion peak, Gold has rotated back below the central pivot of its long-term two-way structure on the weekly timeframe. Globex Gold closed the final week of January near 4,869, firmly back inside the established range.
Importantly, this move does not invalidate the broader structure. The two-way framework remains unchanged. What is unfolding is a rotation into the lower half of the structure, a process commonly observed after extended upside phases across all traded markets.
Markets expand, consolidate, and rotate. Gold is no exception.
Lower structure and demand zones in focus
With price now positioned below the central pivot, attention shifts to the lower structure, where response at key demand zones will help define the next phase of development.
The primary areas of interest are clustered around 4,700 and 4,597, which together define the upper boundary of the lower structure. Holding within this zone would keep the broader framework intact and preserve the possibility of a future rotation back toward the 5,000 pivot.
Failure to hold these levels would allow the rotation to extend further toward the lower boundary of the structure, completing the current corrective phase before the next structural decision point emerges.
Phases, not predictions
Despite the recent volatility, the longer-term trajectory for Gold remains constructive within the broader cycle framework outlined in earlier analyses. However, this desk approach does not rely on forecasts.
Instead, the focus remains on where price sits within structure and how it responds at predefined levels, across both long-term and short-term horizons. The recent advance above 5,000 completed an expansion phase; the current pullback reflects structural digestion, not failure.
From here, price will continue to evolve within the framework already defined. Whether Gold stabilises and rotates higher, or extends the current rotation lower, will be determined by acceptance or rejection at key structural zones.
Closing desk note
The breakout above 5,000 completed a historic expansion.
The pullback that followed reflects rotation within structure.
The work now is observation — documenting response, not anticipation.
These desk updates document a structure-first process, observing how price accepts or rejects predefined levels over time. Coverage spans futures, commodities, forex, bonds, crypto, equities, and indices, with structure providing context before direction. This observation is for informational purposes only and does not constitute financial advice.
Structure defines context; price reveals response.
Author

Denis Joeli Fatiaki
Independent Analyst
Denis Joeli Fatiaki possesses over a decade of extensive experience as a multi-asset trader and Market Strategist.


