Gold returns above $1,700, for how long?

Gold is back above $1,700. Is this a false rebound or a sign that the worst is behind us?
Gold has returned above $1,700! The chart below shows the recent rebound in gold prices. Does it mean that the worst is behind us and now the yellow metal can only go up?
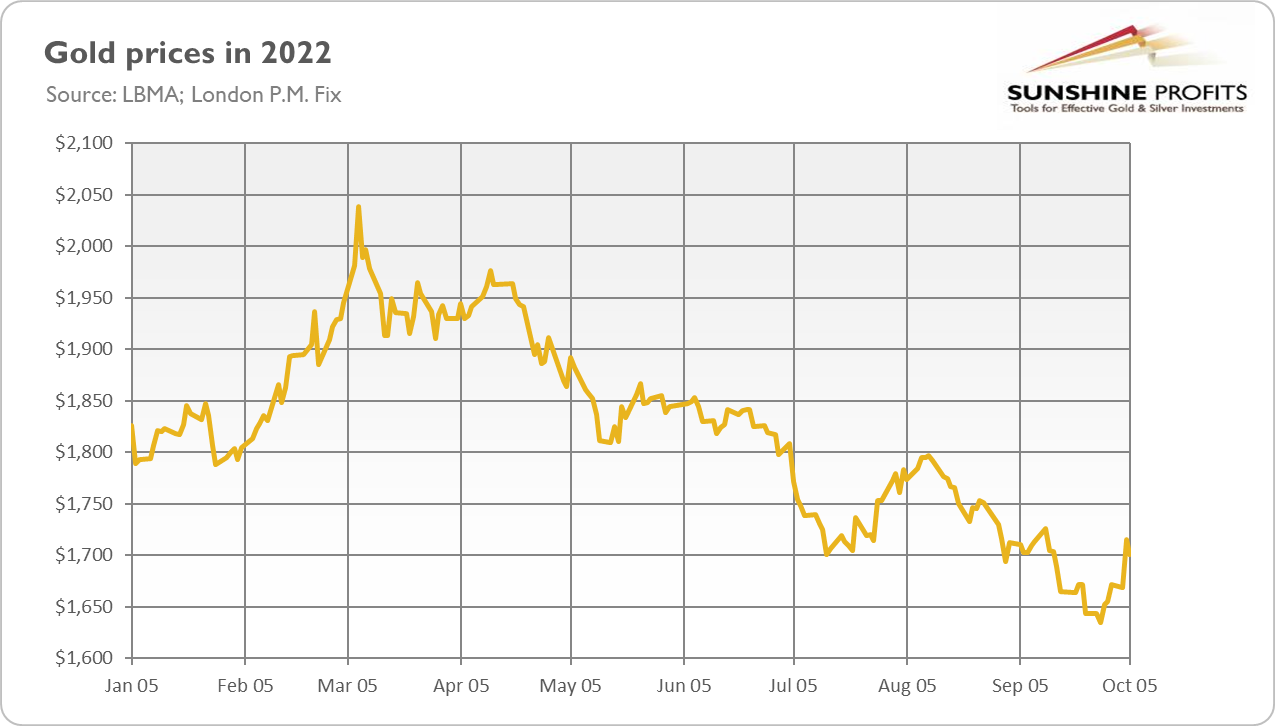
Well, such conclusions would definitely be premature. Let’s remember that September was really awful for the gold bulls, as the average monthly price plunged 4.7% compared to August. The price of gold slid below $1,700 amid strengthened expectations of a more hawkish Fed, and then the actual FOMC meeting pushed gold prices down even further. This is because the Fed delivered another 75-basis point hike and also boosted its projections of the federal funds rate from 3.4% and 3.8% to 4.4% and 4.6% in 2022 and 2023, respectively.
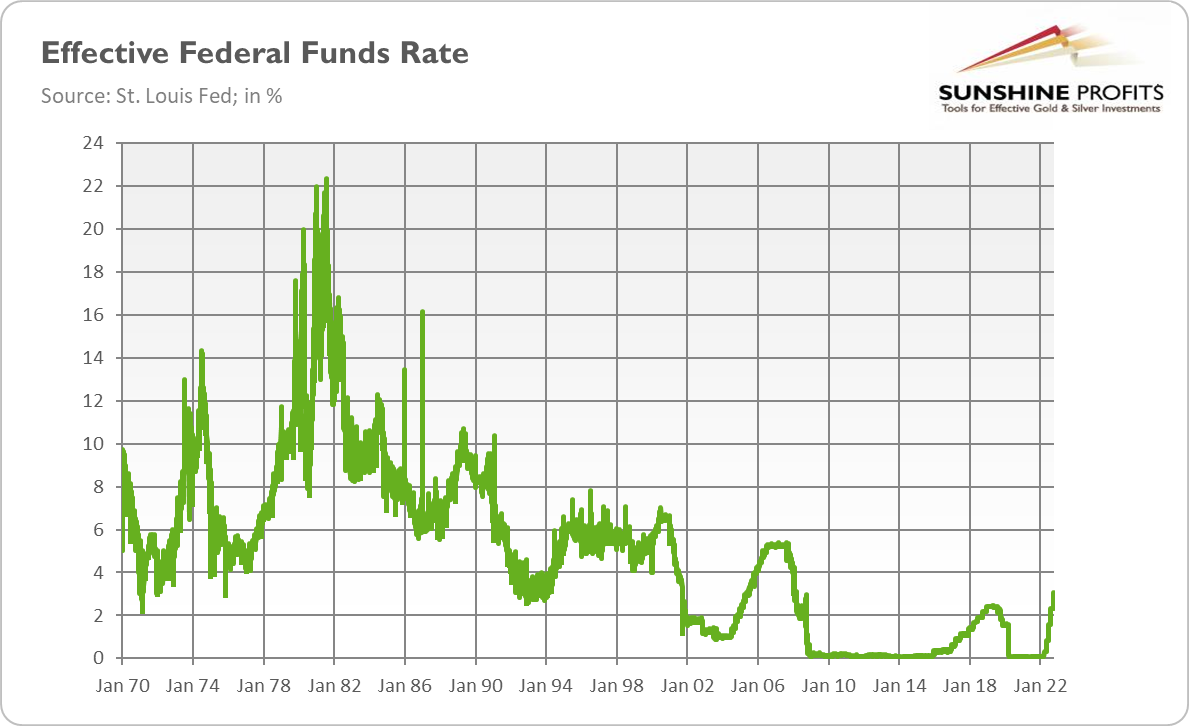
As a result, for the first time since 2008, the federal funds rate exceeded 3%. As the chart below shows, the current tightening cycle is the fastest in more than 40 years, which couldn’t be without negative consequences for the gold market.
A Decline in Yields Helps Gold
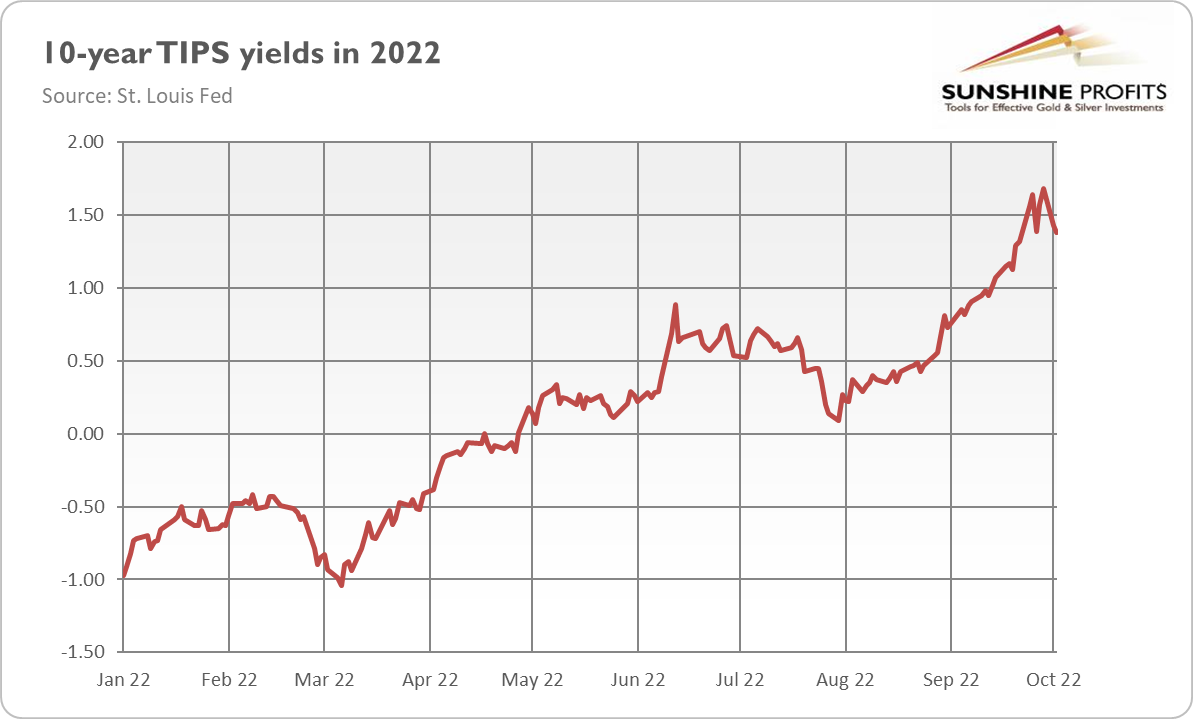
Despite all these headwinds, gold managed to return above $1,700. This is thanks to the decline in real interest rates. As the chart below shows, the yields on 10-year TIPS have moderated somewhat recently, which helped gold catch its breath.
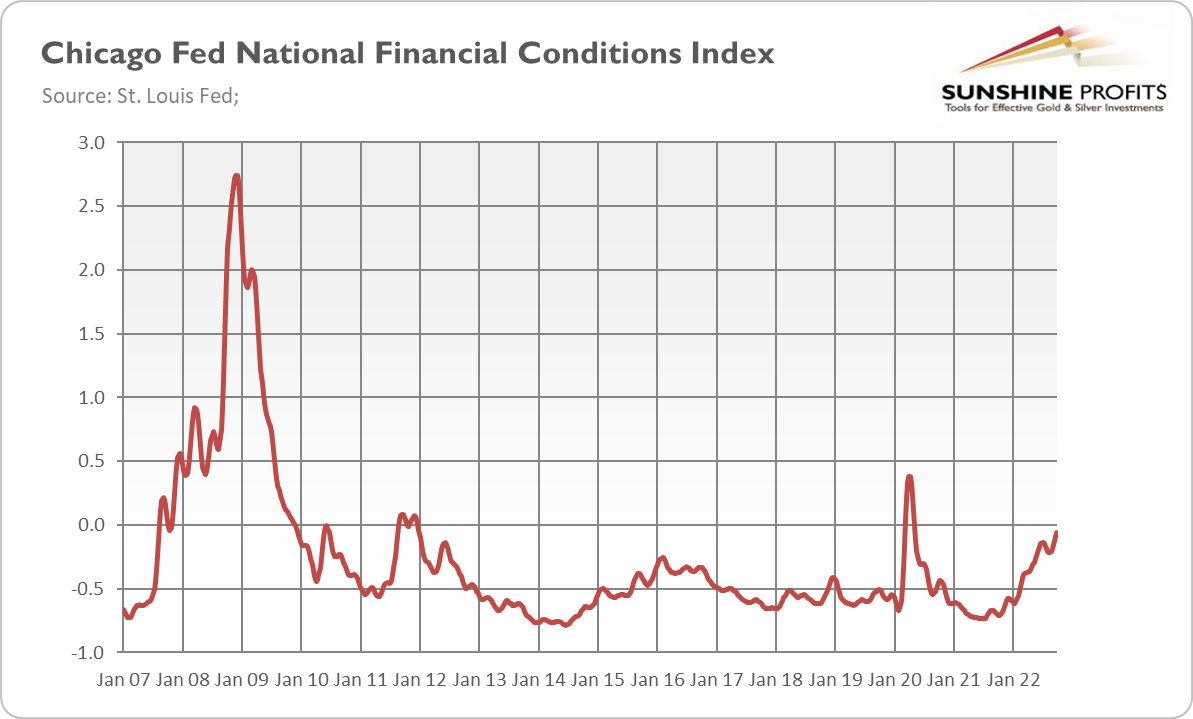
It seems that markets are more and more worried about the risk of excessive tightening of monetary policy and its consequences for the economy. According to Morgan Stanley, dollar liquidity in the United States, Europe, Japan, and China has declined by $4 trillion since March and is falling fast. As the chart below shows, financial conditions – although far from being in a panic mode – have tightened significantly this year. The Chicago Fed’s National Financial Conditions Index moved from -0.74 in mid-2021 to almost 0 (positive values of the index indicate financial conditions that are tighter than average).
Implications for Gold
What does it all mean for the gold market? Well, it goes without saying that gold could decline again amid the aggressive Fed’s stance. The Fed’s pivot may occur, but not necessarily anytime soon, but only in a more distant future. According to Atlanta Fed President Raphael Bostic, “we must remain vigilant because this inflation battle is likely still in early days”.
However, it’s also possible that gold is slowly building the basis for its next rally. Please keep in mind that monetary policy will be less restrictive next year, as – according to the recent dot-plot – the Fed will deliver only one 25-basis-point hike in 2023. Thus, we are quickly moving to the end of the current tightening cycle, and the peak could be already behind us.
Another optimistic issue for gold is that the forecast for GDP growth went down from 1.7% to 0.2% this year, and from 1.7% to 1.2% in 2023. Meanwhile, the projection for the unemployment rate next year increased from 3.9% to 4.4%. The implication is clear: the Fed’s tightening cycle will have negative consequences for the U.S. economy, most likely pushing it into recession. Given the very high inflation, it basically means that the Fed expects stagflation in the coming months. In such an environment, gold should shine.
Want free follow-ups to the above article and details not available to 99%+ investors? Sign up to our free newsletter today!
Author

Arkadiusz Sieroń
Sunshine Profits
Arkadiusz Sieroń received his Ph.D. in economics in 2016 (his doctoral thesis was about Cantillon effects), and has been an assistant professor at the Institute of Economic Sciences at the University of Wrocław since 2017.


