Gold retreats after record high as Powell tempers Fed rate-cut outlook

Gold (XAUUSD) initially hit a record high of $3,707 after the Federal Reserve delivered a 25 basis point rate cut, but gains quickly faded. At first, the rally, fueled by dovish projections of two more cuts, sent the Dollar lower and boosted gold sharply. Soon after, the Fed Chair adopted a measured tone, stressing data dependency and presenting the cut as a protective step. In response, his remarks helped the Dollar recover and triggered a pullback in gold. Despite the retreat, rate-cut expectations remain intact and continue to support gold. Markets are now watching U.S. job data and geopolitical developments for the next move.
Gold hits record high but retreats as Powell cools rate-cut hopes
Gold surged to a record high of $3,707 but failed to hold gains, retreating into a consolidation phase. Initially, the rally was triggered by the Fed’s 25 basis point rate cut. Officials also projected two more cuts in their updated outlook. Markets viewed the signals as dovish, fueling a strong gold rally and widespread Dollar losses.
However, the optimism didn’t last long. In his post-meeting press conference, Fed Chair Jerome Powell took a more measured tone. Specifically, Powell emphasized that any future rate cuts would depend on incoming data. Additionally, he called the recent rate cut a precautionary step to address softening in the job market. His remarks helped the Dollar rebound and prompted a pullback in gold.
Although gold reversed, the outlook for additional rate cuts remains unchanged. The CME FedWatch Tool now shows an 87.7% chance of another 25 bps cut in October, up from 74.3% just a day earlier. Pullbacks in gold could attract renewed interest. Moreover, the outlook remains favorable if the Fed receives more justification for rate cuts from economic or geopolitical developments. Looking ahead, the next directional move in gold may depend on U.S. job data and unfolding geopolitical events.
Gold breaks out of symmetrical triangle, confirms $900 target range
The gold chart below shows a clear breakout from a symmetrical triangle pattern. Following a $900 surge earlier this year, gold entered a consolidation phase that formed this triangle structure. The formation developed over several months, with compressing price action creating a decisive breakout point.
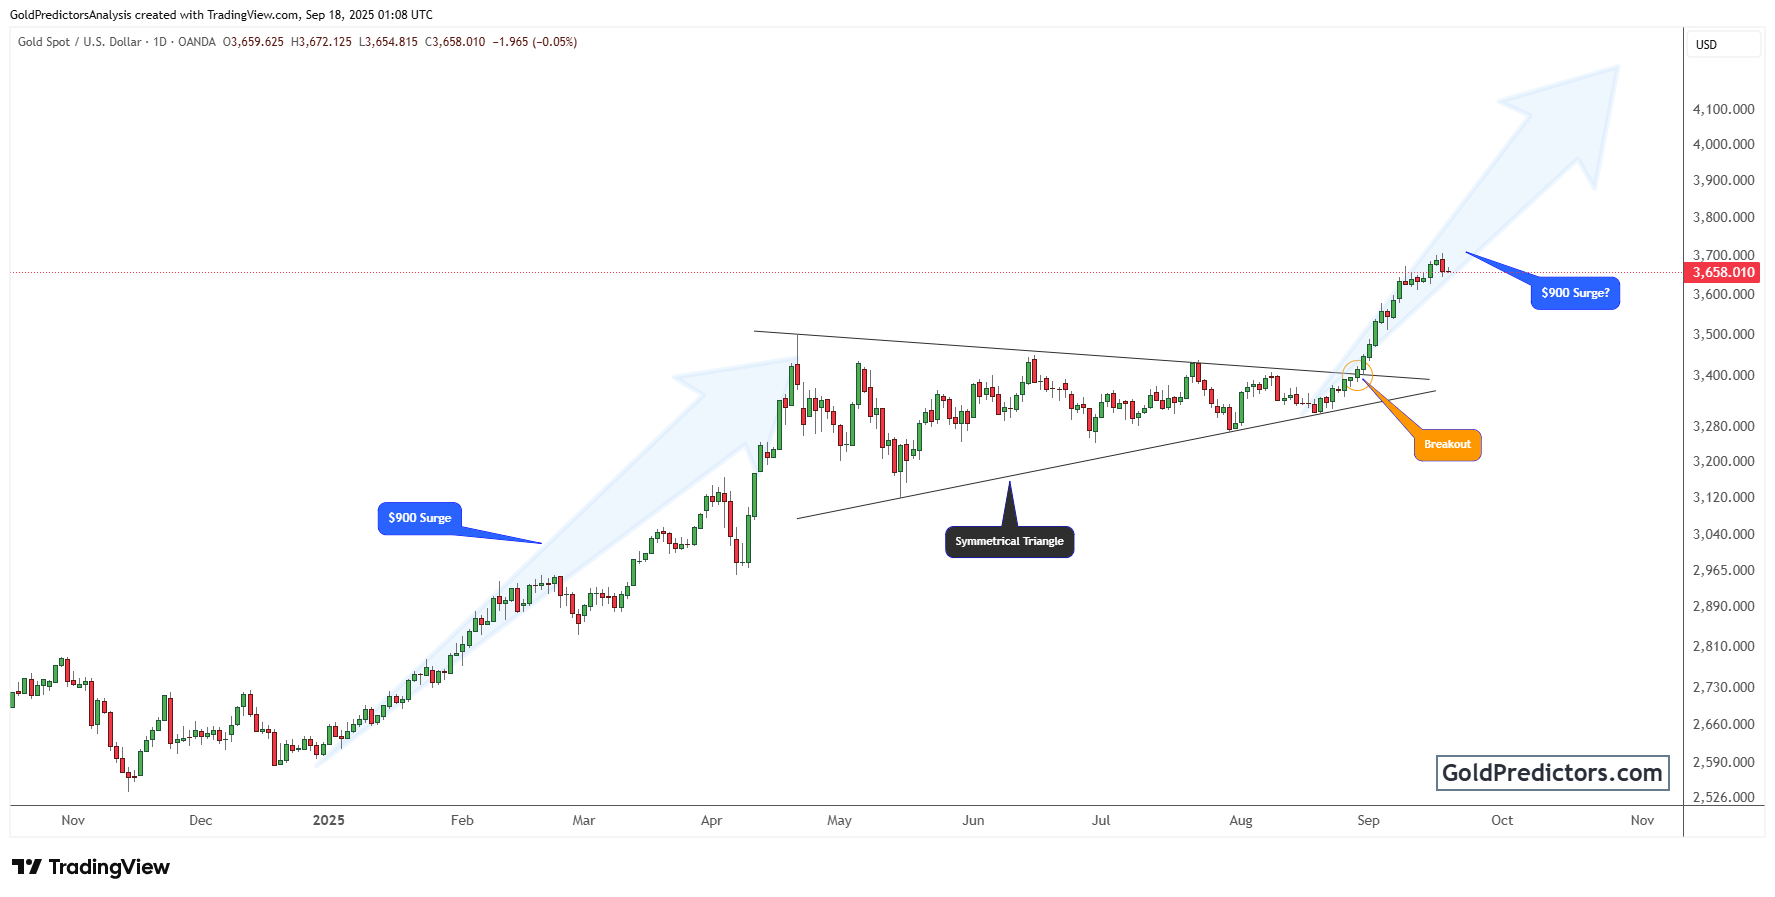
In early September, gold broke out decisively above the triangle near $3,280. As a result, the breakout triggered another sharp rally, mirroring the earlier $900 surge and pushing prices to a new high near $3,707. Ultimately, this move confirmed the triangle as a classic consolidation phase and signaled a strong continuation of the broader uptrend.
Additionally, the breakout also matches the estimated move based on the triangle’s height, implying a $900 upside target. This suggests a potential move to $4,100 if momentum continues. Meanwhile, gold is currently trading slightly below $3,670, suggesting a possible retest of the breakout area. Importantly, as long as prices remain above $3,600, the bullish structure stays intact.
Gold outlook: Dovish Fed supports rally despite Powell’s caution
Gold continues to show strength from both technical and macro perspectives, even after the recent decline. The symmetrical triangle breakout, combined with dovish Fed signals, supports the broader uptrend. As long as prices hold above key support, the path toward higher highs remains intact. Looking ahead, the next phase of gold’s move will likely depend on upcoming economic data and global developments. If momentum holds, the $4,100 target remains within reach.
Unlock exclusive gold and silver trading signals and updates that most investors don’t see. Join our free newsletter now!
Unlock exclusive gold and silver trading signals and updates that most investors don’t see. Join our free newsletter now!
Author

Muhammad Umair, PhD
Gold Predictors
Muhammad Umair is a financial markets analyst and investor who focuses on the forex and precious metals markets.


