Gold price slips as Hormuz tensions lift Oil and inflation fears

Gold (XAUUSD) prices remain under pressure as renewed conflict in the Middle East strengthens the US Dollar and lifts Oil prices. Rising inflation concerns and expectations that the Federal Reserve could keep interest rates higher for longer have added to the weakness. Attention now shifts to key economic releases and geopolitical developments that could influence gold prices.
Gold price retreats as Middle East conflict strengthens Dollar and lifts Oil prices
Gold started Monday on a weaker note after renewed conflict in the Middle East increased market uncertainty. Fresh hostilities between the United States and Iran raised concerns about disruptions to global energy supplies. Iran's renewed closure of the Strait of Hormuz pushed Oil prices higher and increased worries about inflation. The stronger US Dollar added further pressure on gold, extending the metal's early-week losses.
The latest Monetary Policy Report from the Federal Reserve highlighted stronger price pressures, increasing inflation concerns. The central bank said inflation accelerated during the spring because of tariffs, higher energy costs, and continued investment in artificial intelligence infrastructure. These developments supported expectations that the Fed could maintain higher interest rates for longer, creating additional pressure on gold prices.
Market attention now turns to the upcoming US Consumer Price Index data and Fed Chair Kevin Warsh's first semi-annual testimony before Congress. These events could influence expectations for future monetary policy. Investors will also continue monitoring developments in the Middle East and movements in Oil prices, as both remain important drivers of market sentiment.
Gold price trades within triangle pattern as support holds firm
The gold chart below shows price trading inside a large triangle pattern. The upper boundary has acted as resistance throughout recent months, while the horizontal lower boundary has repeatedly provided support. Price has continued to respect both trendlines, keeping the broader consolidation pattern intact.
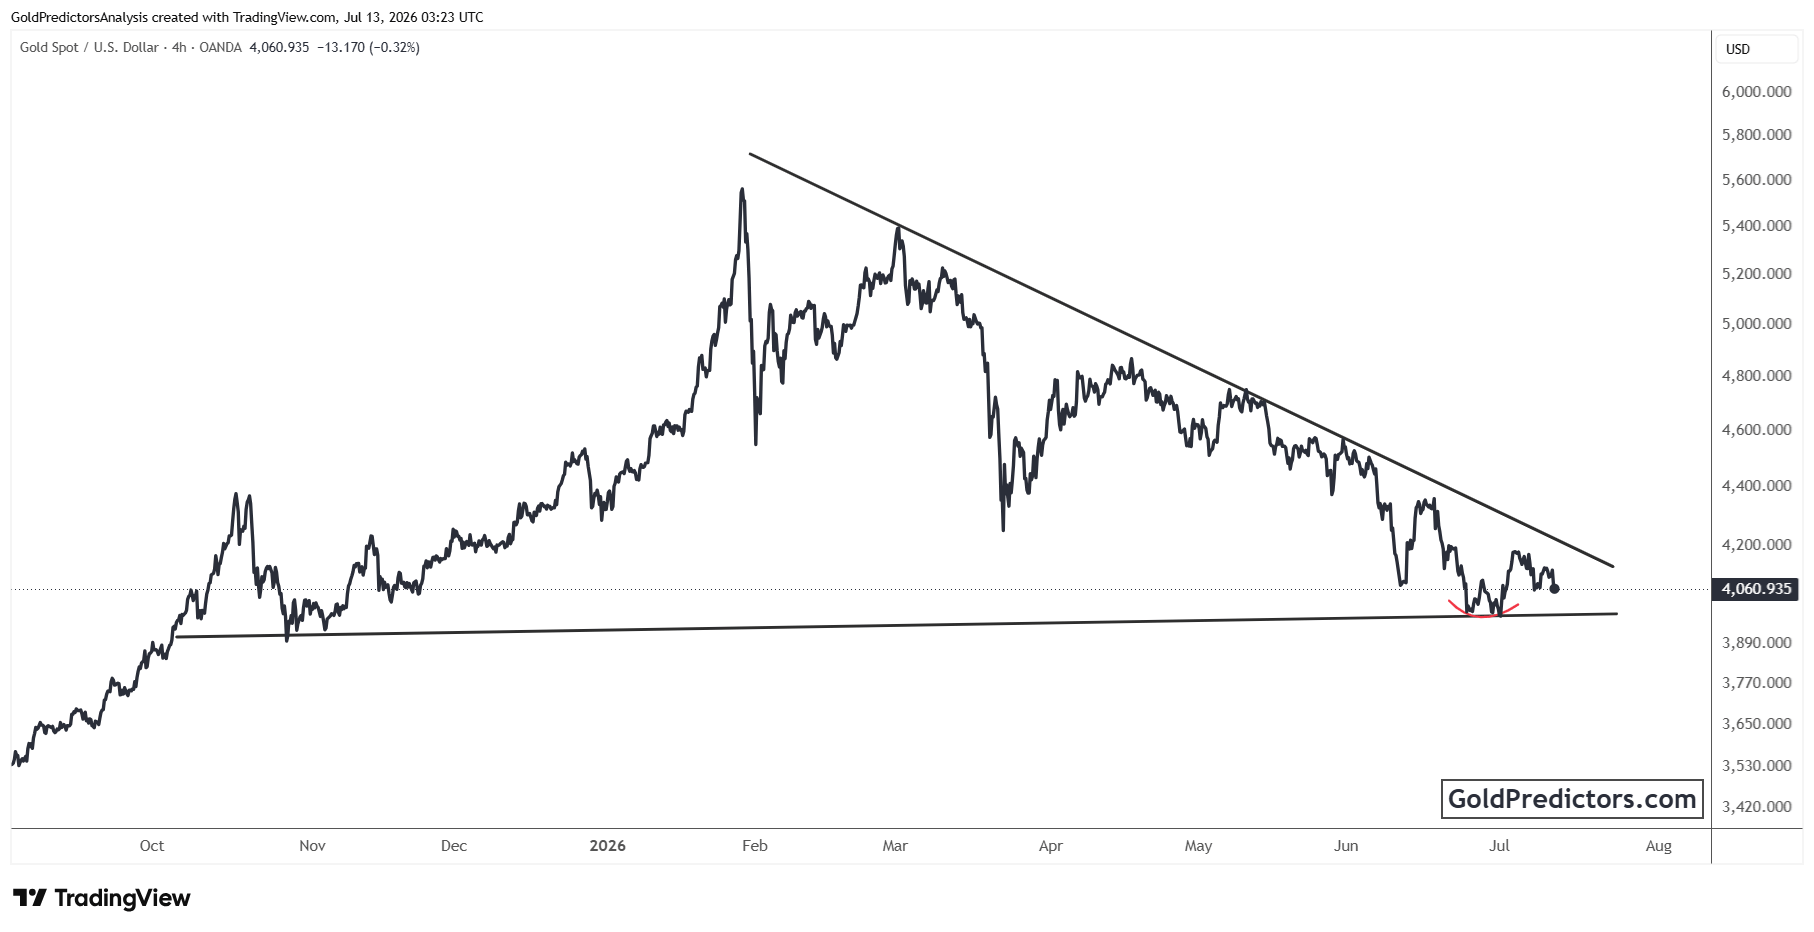
Gold recently retreated toward the lower boundary as the descending resistance continued to cap upward movement. The latest decline brought price back to this important support zone, where price previously stabilized. The recent reaction suggests that this level remains an important technical area. However, price is still trading below the descending resistance trendline, showing that the broader short-term trend remains under pressure.
A sustained hold above the horizontal support could keep the triangle structure intact and allow another attempt toward the descending resistance line. On the other hand, a confirmed move below the lower boundary would weaken the current structure and increase the risk of additional downside. The reaction around this support level is likely to determine the next major directional move.
Gold outlook: Geopolitical risks and triangle support shape next move
Gold remains under pressure as geopolitical tensions, higher Oil prices, and expectations of a cautious Federal Reserve continue to support the US Dollar. The upcoming US inflation data and Fed Chair Kevin Warsh's testimony could play an important role in shaping market expectations. At the same time, gold continues to hold near a key support level within the triangle pattern. The reaction around this technical level is likely to determine the metal's next major directional move.
Unlock exclusive gold and silver trading signals and updates that most investors don’t see. Join our free newsletter now!
Author

Muhammad Umair, PhD
Gold Predictors
Muhammad Umair is a financial markets analyst and investor who focuses on the forex and precious metals markets.

















