Gold Price Prediction: XAU/USD bets on reaching 1,855.31 at start of the week: trading opportunity
- Gold has been holding onto its gains as a new week kicks off.
- A bullish scenario is emerging in the short term, providing an opportunity.
- The MACD points to downside risks that should be factored in any trade.

The XAU/USD pair is consolidating the climb towards the 1,840.00 range, following a similar development to the one we have seen in the 1,810.00 range in recent weeks. In the short term, the downtrend line from the relative highs at 1,847.80 (A) has been breached to the upside, however, a further upward push is needed to verify the breakout.
*Note: This content first appeared as an answer to a Premium user. Sign up and get unfettered access to our analysts and exclusive content.
The price now rests on a bullish line which is part of the long-term parallel line structure at the 1,836.35 price level. If the pair pierces below this price, we can expect a slide to the support level at 1,832.09 first and then to 1,827.94, if there is a bearish extension in the move.
Above the current price, resistances are located at 1,838.42, 1,842.80 and 1,846.85.
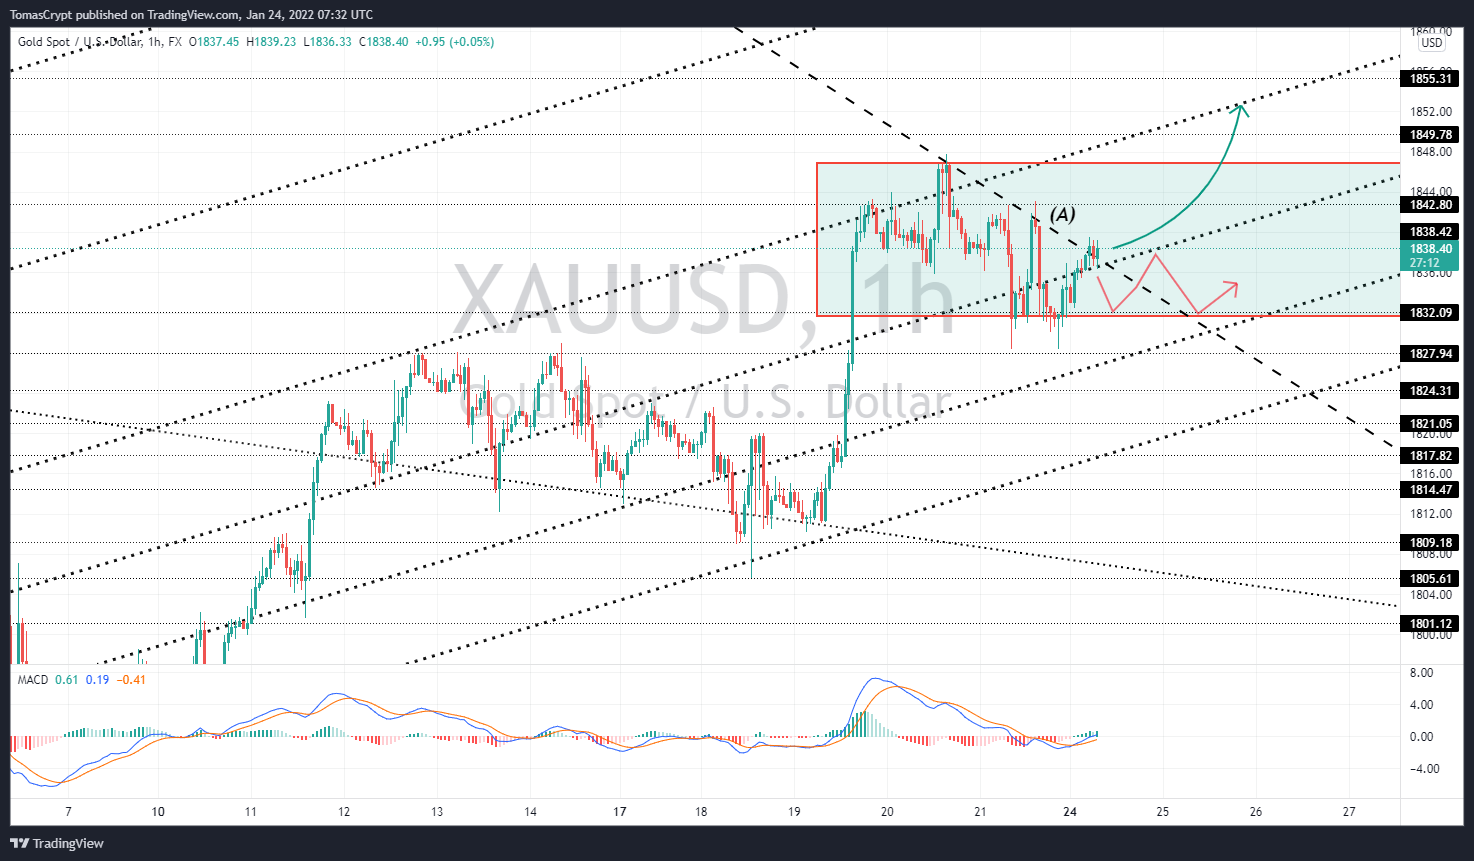
There are bullish signs from the Moving Average Convergence Divergence indicator (MACD) on the hourly range chart, which is showing the exponential moving averages crossed to the upside, albeit penalized by positioning below the zero level of the indicator.
We propose a bullish scenario in the short term as long as the price remains above 1,836.26, with a primary target at 1,846.35, which, if surpassed, would open a new up move towards 1,849.79 and 1,855.31.
The short-term bullish scenario poses downside risks – graphically represented by the MACD indicator structure – and will be cancelled if the 1,836.26 support level is breached at the close of the hourly candle.
Premium
You have reached your limit of 3 free articles for this month.
Start your subscription and get access to all our original articles.
Author

Tomas Salles
FXStreet
Tomàs Sallés was born in Barcelona in 1972, he is a certified technical analyst after having completing specialized courses in Spain and Switzerland. He expanded his technical training following the guidance of great experts on the financial markets.


