Gold Price Forecast: XAU/USD’s bearish potential to remain intact, focus on weekly close
- Gold price set for first weekly loss in five amid firmer US dollar.
- Gold bulls briefly benefit from dovish ECB, US stimulus optimism on Thursday.
- Bearish bias remains intact for gold despite Thursday’s rebound.

Gold price staged a decent bounce from eight-day lows of $1793 on Thursday and ended the day in the green at $1807, bringing a halt to a two-day downtrend from $1825 levels. Despite witnessing two-way businesses on yet another day, gold price held within its recent trading range around the $1800 mark, with the upside capped by a broadly firmer US dollar. Looming Delta covid variant flareups flag concerns over global economic recovery and underpinned the safe-haven demand for the greenback. Weaker US Jobless Claims data also added to the economic concerns and supported the buck. Meanwhile, lower US bond yields and dovish European Central Bank (ECB) monetary policy decision helped cushion the downside in gold price. US stimulus optimism, with the infrastructure spending package likely to come through on Monday, put a floor under the yellow metal.
Gold sellers are back in the game on the final trading day of this week, bearing the brunt of a downbeat market mood, which favors the dollar bulls. Extension of the covid lockdowns in South Korea and Australia intensify economic concerns, spooking investors. The late recovery gains in the US yields are also weighing on the non-yielding gold. Traders await fresh cues on the global economic recovery from the upcoming releases of the UK, Eurozone and the US Preliminary Manufacturing and Services PMI reports. The business activity numbers will have a significant impact on the risk sentiment, in turn, influencing gold price direction. However, with escalating covid tensions, lower figures are expected, which could bump up the dollar’s haven demand and weigh negatively on gold price. Markets could also turn cautious ahead of next week's FOMC meeting.
Gold Price Chart - Technical outlook
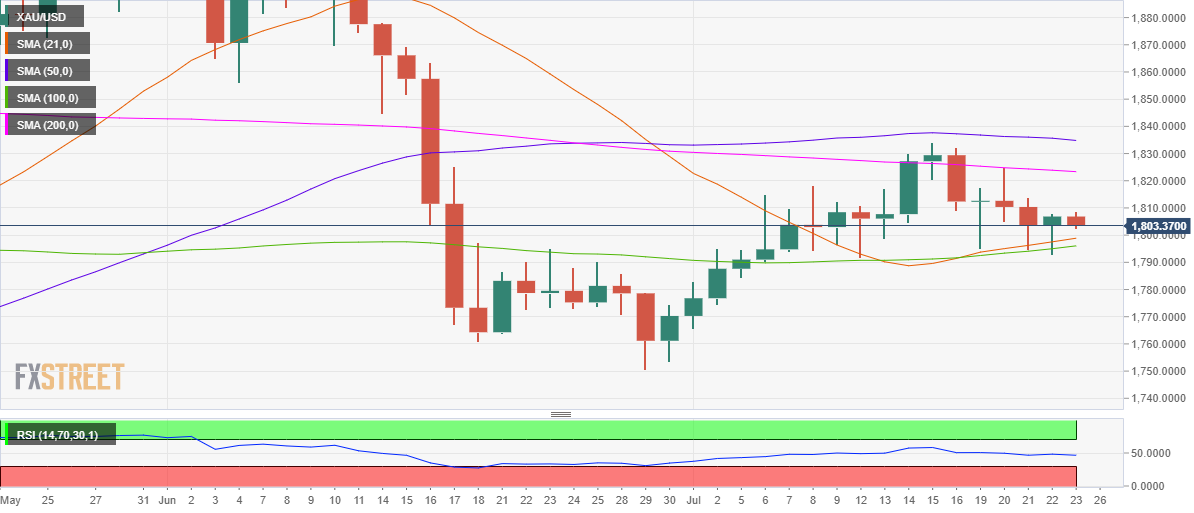
Gold: Daily chart
Nothing seems to have changed for gold traders as we look at the daily chart.
Gold bears yearn for a sustained break below $1799-$1796 support area, where the 21-Daily Moving Average (DMA) and 100-DMA intersect.
A daily closing below that level is needed to revive the bearish momentum.
Although, gold price may find immediate support at Thursday’s low of $1793, below which the $1790 round number could be challenged.
Acceptance below the latter could trigger a drop towards the July lows of $1767.
The 14-day Relative Strength Index (RSI) remains below the 50.00 level, suggesting that the downside risks continue to persist.
On the flip side, minor resistance awaits around $1809, intraday’s and Thursday’s highs.
The 200-DMA at $1824 will continue to guard the upside. Ahead of that the July 21 high of $1814 could test the bullish commitments en-route the critical 200-DMA hurdle at $1823.
Premium
You have reached your limit of 3 free articles for this month.
Start your subscription and get access to all our original articles.
Author

Dhwani Mehta
FXStreet
Residing in Mumbai (India), Dhwani is a Senior Analyst and Manager of the Asian session at FXStreet. She has over 10 years of experience in analyzing and covering the global financial markets, with specialization in Forex and commodities markets.


