Gold Price Forecast: XAU/USD tests bullish commitments amid easing trade tensions
- Gold price falls for a third straight day on Thursday, breaching $3,260 support.
- The US Dollar builds on recent recovery amid hopes for US trade deals with its Asian partners.
- Gold price confirms a rising channel breakdown; 21-day SMA at $3,230 appears at risk.

Gold price is extending its bearish momentum into a third consecutive day early Thursday, languishing near two-week lows. Trade headlines have yet again overshadowed the US economic data, significantly impacting the traditional safe-haven Gold price.
Gold price weighs trade talks ahead of US data
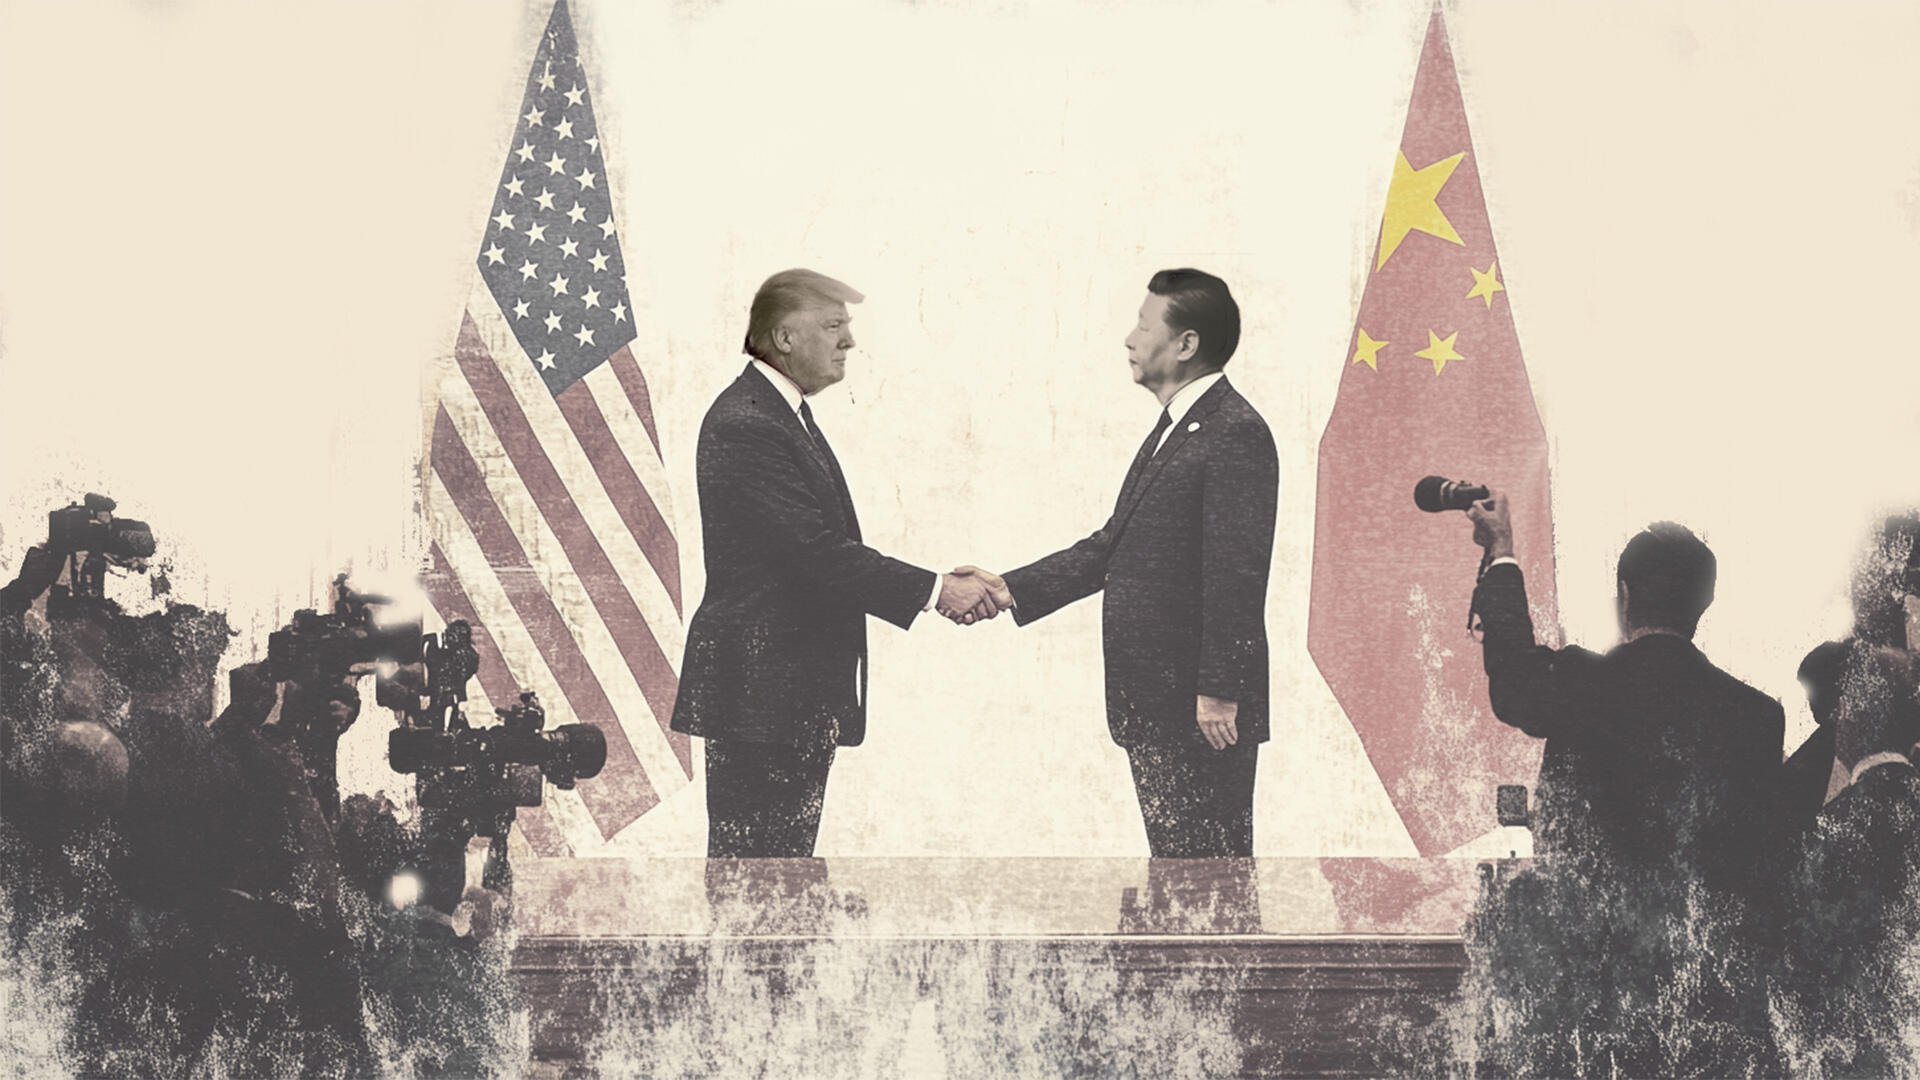
The US Dollar (USD) builds on its recovery, capitalizing on the latest remarks from US President Donald Trump, stating that he has "potential" trade deals with India, South Korea and Japan and that there is a very good chance of reaching an agreement with China.
These optimistic comments on the trade front lift risk sentiment and trigger a fresh leg down in the USD-denominated Gold price, diminishing its haven appeal. Hopes over a likely US-China trade war de-escalation continue to act as a headwind for the bright metal.
Meanwhile, markets shrug off the rejection of a bipartisan measure to block Trump's tariffs by the Senate and the earlier comments from US Trade Representative Jamieson Greer, citing that no official talks were happening with China.
All in all, Gold’s fate hinges on the sentiment surrounding trade developments, as any reaction to the US economic data releases remains short-lived. Traders will also look to the US ISM Manufacturing PMI and Jobless Claims data for some trading incentives ahead of Friday’s Nonfarm Payrolls (NFP) showdown.
The first look of the US annualized Gross Domestic Product (GDP) on Wednesday showed that the US economy contracted for the first time in three months to 0.3% in the first quarter of 2025 as US firms frontloaded to get ahead of the US levies, resulting in an imports surge.
Meanwhile, the core Personal Consumption Expenditures (PCE) Price Index, which excludes volatile food and energy prices, rose 2.6% in March, down from the 3% increase reported in February.
Gold price jumped briefly above $3,300 following the US GDP and inflation data but failed to sustain the rebound on Trump’s conciliatory remarks following the bleak GDP reading. The US President said in his Truth Social post that “this will take a while, has NOTHING TO DO WITH TARIFFS, only that he left us with bad numbers, but when the boom begins, it will be like no other. BE PATIENT!!!”
Gold price technical analysis: Daily chart
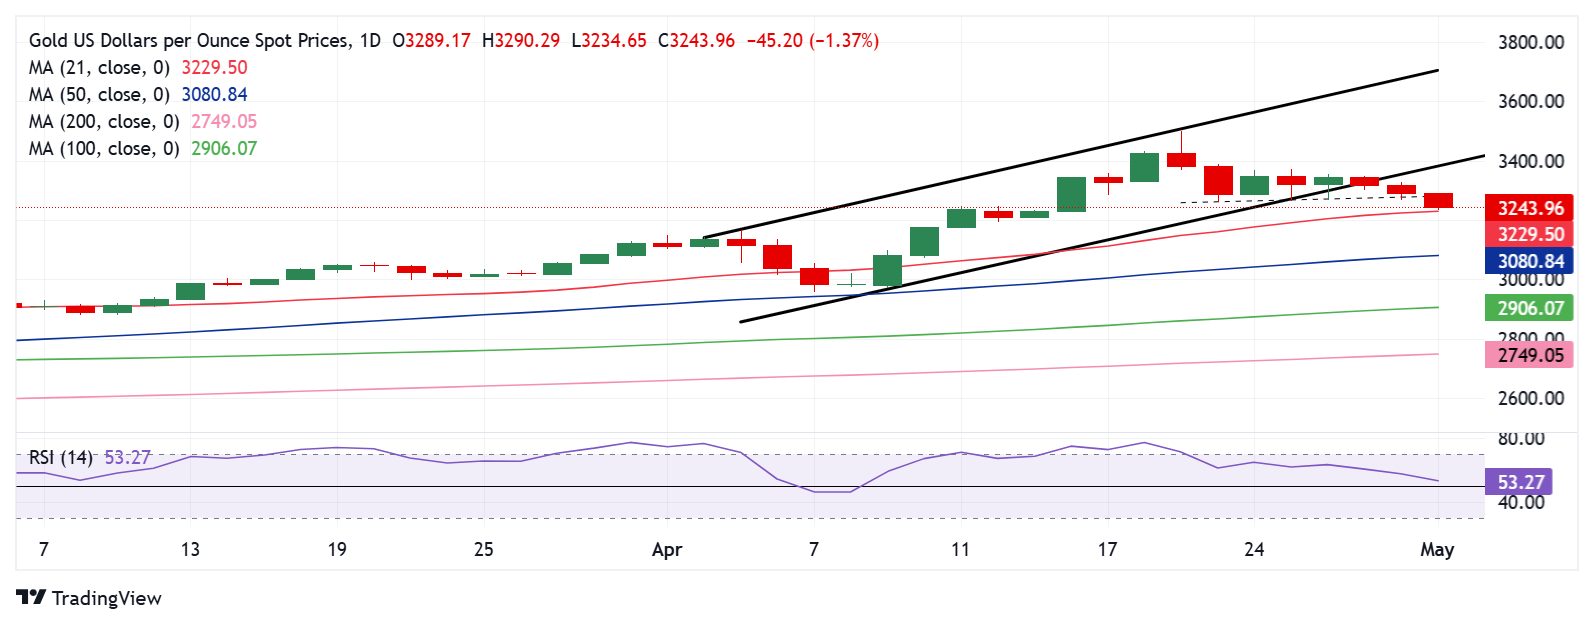
At the time of writing, Gold price extends the downside break of a three-week-long rising channel confirmed on Wednesday.
Gold price settled well below the rising trendline support, then at $3,351, on Wednesday, paving the way for more downside.
The 14-day Relative Strength Index (RSI) has stretched its descent, currently testing the midline near 53.50. The leading indicator remains above 50, keeping some hopes alive for Gold buyers.
Gold price must defend the critical 21-day Simple Moving Average (SMA) at $3,230 on a daily closing basis to keep the doors open for a turnaround.
If the latter holds the fort, Gold buyers could test the rising channel support-now-resistance at $3,383 on the road to recovery.
However, recapturing the previous day’s high of $3,328 is critical at first.
On the other hand, if sellers crack the 21-day SMA at $3,230 on a sustained basis, a fresh decline toward the $3,150 psychological level cannot be ruled out.
The 50-day SMA at $3,081 will be next on sellers’ radars.
US-China Trade War FAQs
Generally speaking, a trade war is an economic conflict between two or more countries due to extreme protectionism on one end. It implies the creation of trade barriers, such as tariffs, which result in counter-barriers, escalating import costs, and hence the cost of living.
An economic conflict between the United States (US) and China began early in 2018, when President Donald Trump set trade barriers on China, claiming unfair commercial practices and intellectual property theft from the Asian giant. China took retaliatory action, imposing tariffs on multiple US goods, such as automobiles and soybeans. Tensions escalated until the two countries signed the US-China Phase One trade deal in January 2020. The agreement required structural reforms and other changes to China’s economic and trade regime and pretended to restore stability and trust between the two nations. However, the Coronavirus pandemic took the focus out of the conflict. Yet, it is worth mentioning that President Joe Biden, who took office after Trump, kept tariffs in place and even added some additional levies.
The return of Donald Trump to the White House as the 47th US President has sparked a fresh wave of tensions between the two countries. During the 2024 election campaign, Trump pledged to impose 60% tariffs on China once he returned to office, which he did on January 20, 2025. With Trump back, the US-China trade war is meant to resume where it was left, with tit-for-tat policies affecting the global economic landscape amid disruptions in global supply chains, resulting in a reduction in spending, particularly investment, and directly feeding into the Consumer Price Index inflation.
Author

Dhwani Mehta
FXStreet
Residing in Mumbai (India), Dhwani is a Senior Analyst and Manager of the Asian session at FXStreet. She has over 10 years of experience in analyzing and covering the global financial markets, with specialization in Forex and commodities markets.