Gold Price Forecast: XAU/USD targets $1,975 amid a triangle breakout, Ukraine crisis, NFP eyed
- Gold price is positioned for a fresh uptrend above the $1,950 barrier.
- Russian attack on Ukraine’s nuclear power plant, soaring oil prices fuel risk-aversion.
- Symmetrical triangle breakout on the 4H chart points to more gains for gold price.

Gold price is seeing increased demand in the second half of this week, as it is shining once again due to resurgent safe-haven flows amid a lack of any principal outcome from round two of Russia-Ukraine peace talks.
However, the key reasons behind gold’s renewed upside on Friday is due to the intensifying tensions between the two warring nations, especially after Russia attacked the Zaporizhzhia Nuclear Power Plant, Europe's largest nuclear power station in Ukraine. Investors got worried about the radiation risks after the fire was reported at the site, courtesy of the Russian troops’ shelling. Ukrainian President Volodymyr Zelensky said that attack on nuclear facilities could be the "end of Europe." Escalating nuclear risks hit the risk sentiment and drove gold price to the highest level in six days just above $1,950. Although the US dollar’s strength alongside capped the gains in the bright metal.
In the day ahead, the Ukraine-Russia war re-escalation will likely keep investors away from higher-yielding assets, boding well for the traditional safe-haven gold. Additionally, the Ukrainian nuclear plant attack news has given a shot in the arm to oil bulls, which will aggravate concerns over raging inflation. Gold price could attract further bids on its appeal as an inflation hedge as well. Also, of relevance remains the US Nonfarm Payrolls (NFP) data due later this Friday, with only 400K jobs likely to have added in America last month. If the US NFP figures disappoint markets, then it will weigh on the Fed’s aggressive tightening expectations, offering additional impetus to gold buyers.
Gold Price Chart - Technical outlook
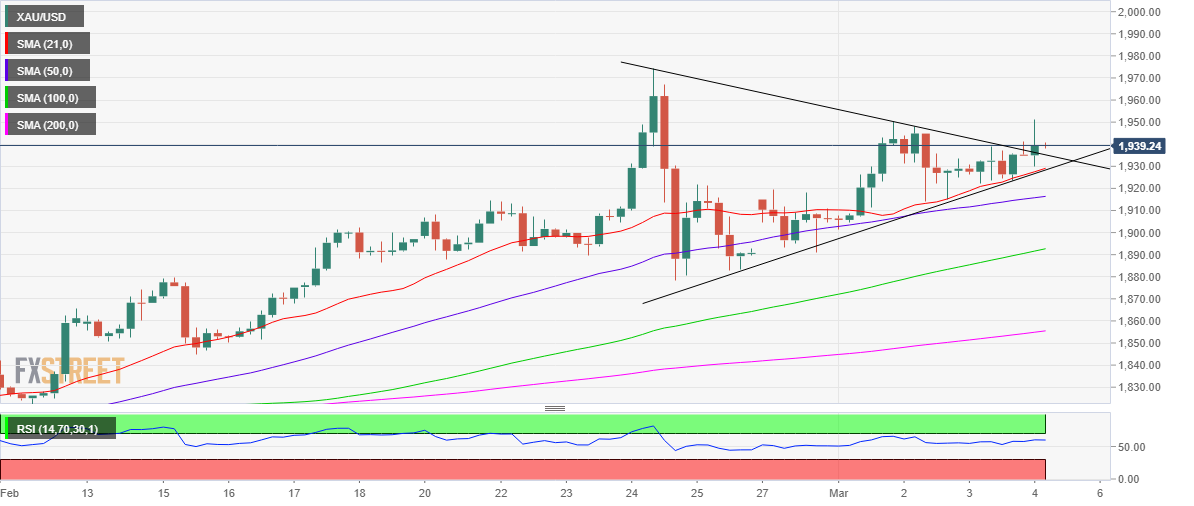
Gold: Four-hour chart
Apart from the encouraging fundamentals favoring gold price, the metal’s technical setup on the four-hour chart also points to more upside.
That said, the yellow metal has confirmed an upside breakout from a symmetrical triangle formation after yielding a four-hourly candlestick closing above the falling trendline resistance at $1,936.
With the bullish breakout, gold price is positioned to retest the 13-month highs of $1,975 if it finds acceptance above the $1,950 psychological barrier.
The Relative Strength Index (RSI) is holding firmer above the midline, adding credence to a potential move higher.
On the downside, the immediate cushion is seen at the triangle resistance turned support at $1,935, below which a sharp sell-off could be triggered towards the powerful cap of $1,928.
At that point, the triangle support and bullish 21-Simple Moving Average (SMA) coincide.
A firm break below the latter could lead to the pattern failure, fuelling a fresh downswing towards the ascending 50-SMA at $1,916.
Premium
You have reached your limit of 3 free articles for this month.
Start your subscription and get access to all our original articles.
Author

Dhwani Mehta
FXStreet
Residing in Mumbai (India), Dhwani is a Senior Analyst and Manager of the Asian session at FXStreet. She has over 10 years of experience in analyzing and covering the global financial markets, with specialization in Forex and commodities markets.


