Gold Price Forecast: XAU/USD set for more pain if 200-day SMA support fails
- Gold price is consolidating the previous week’s losses early Monday.
- US Dollar fails to benefit from higher US Treasury bond yields after Moody’s US outlook downgrade.
- Gold price looks to break the 200-day SMA support at $1,935 amid bearish RSI.

Gold price is languishing at a three-week low of $1,933 early Monday, amid a cautious start to a big week. The United States Dollar (USD) is trading listlessly, despite an advance in the US Treasury bond yields following hawkish comments from US Federal Reserve (Fed) Chairman Jerome Powell on Friday.
Gold price eyes Tuesday’s US Consumer Price Index data
Meanwhile, the US Dollar is bearing the brunt of the Moody’s Investors Service’s US credit outlook downgrade. Late Friday, the ratings agency slashed its outlook on the US credit rating to ‘negative’ from ‘stable’, in the face of large fiscal deficits and a decline in debt affordability.
Further, expectations of a softer annual US Consumer Price Index (CPI) print on Tuesday is also weighing on the US Dollar, helping cap the downside in Gold price. Markets are pricing a 10% probability of a rate hike by the US Federal Reserve (Fed) in December, with the odds unchanged even after Fed Chair Powell, in a policy panel on “Monetary Policy Challenges In A Global Economy” on Friday, sounded hawkish.
The Fed President said that “the Federal Open Market Committee is committed to achieving a stance of monetary policy that is sufficiently restrictive to bring inflation down to 2 percent over time; we are not confident that we have achieved such a stance.”
However, the US Dollar could find upside traction should the advance in the US Treasury bond yields gather steam. Subsequently, Gold price could resume its bearish momentum on resurgent US Dollar demand, as markets are likely to remain risk-averse ahead of Tuesday’s US CPI data release and the much-awaited meeting between US President Joe Biden and Chinese President Xi Jinping at the Asia-Pacific Economic Cooperation (APEC) Summit on Wednesday.
Gold price technical analysis: Daily chart
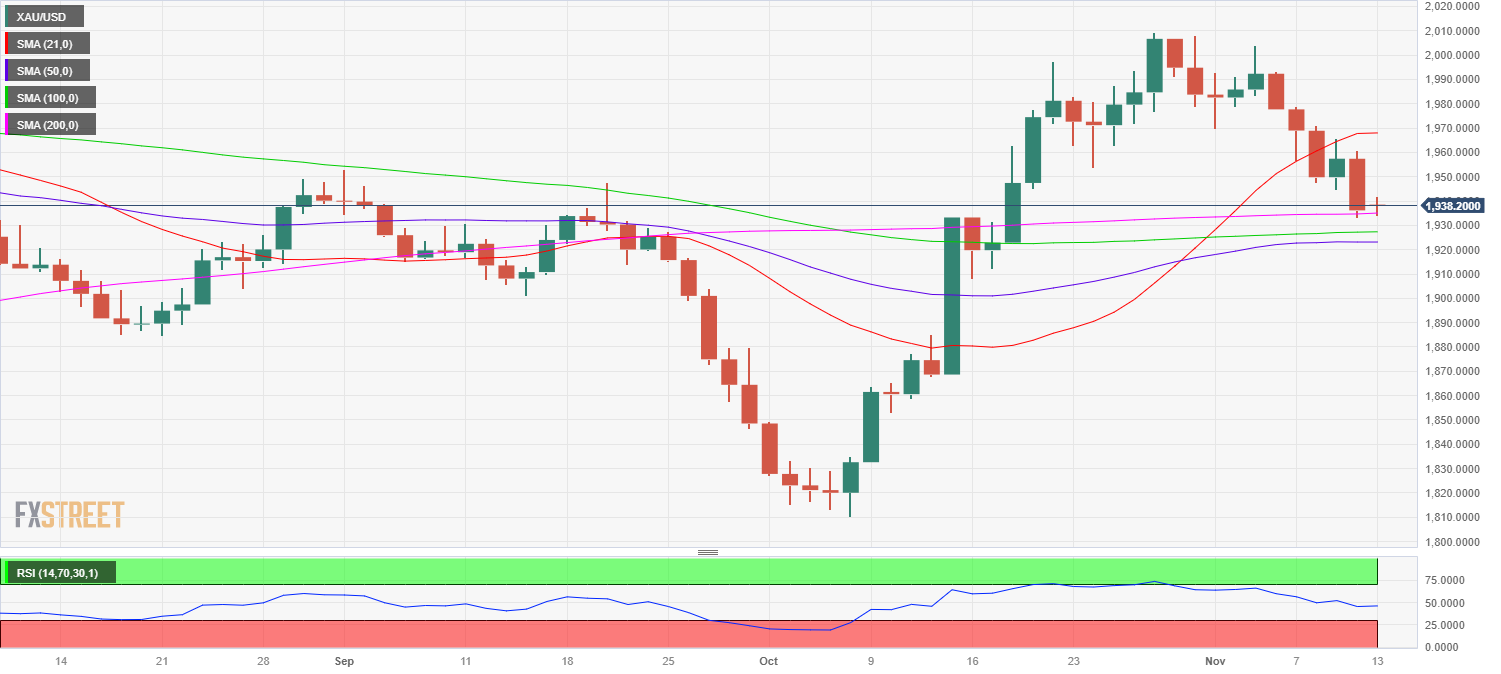
Gold price tested the critical 200-day Simple Moving Average (SMA) at $1,935 on Friday, although managed to close above the latter on a weekly closing basis.
Therefore, it remains to be seen if Gold price will defend the 200-day SMA on Monday. Daily closing below the latter will put the powerful support near $1,925 at risk. At that point, the 100-day SMA and 50-day SMA close in.
A sharp drop toward the October 16 low of $1,908 will be on the cards should the abovementioned confluence demand area fail to hold.
On the other hand, Gold buyers will need to take out Friday’s high of $1,961 to recapture the 21-day SMA at $1,968 on a sustained basis. The next topside barrier is aligned at the $1,980 round figure.
Premium
You have reached your limit of 3 free articles for this month.
Start your subscription and get access to all our original articles.
Author

Dhwani Mehta
FXStreet
Residing in Mumbai (India), Dhwani is a Senior Analyst and Manager of the Asian session at FXStreet. She has over 10 years of experience in analyzing and covering the global financial markets, with specialization in Forex and commodities markets.


