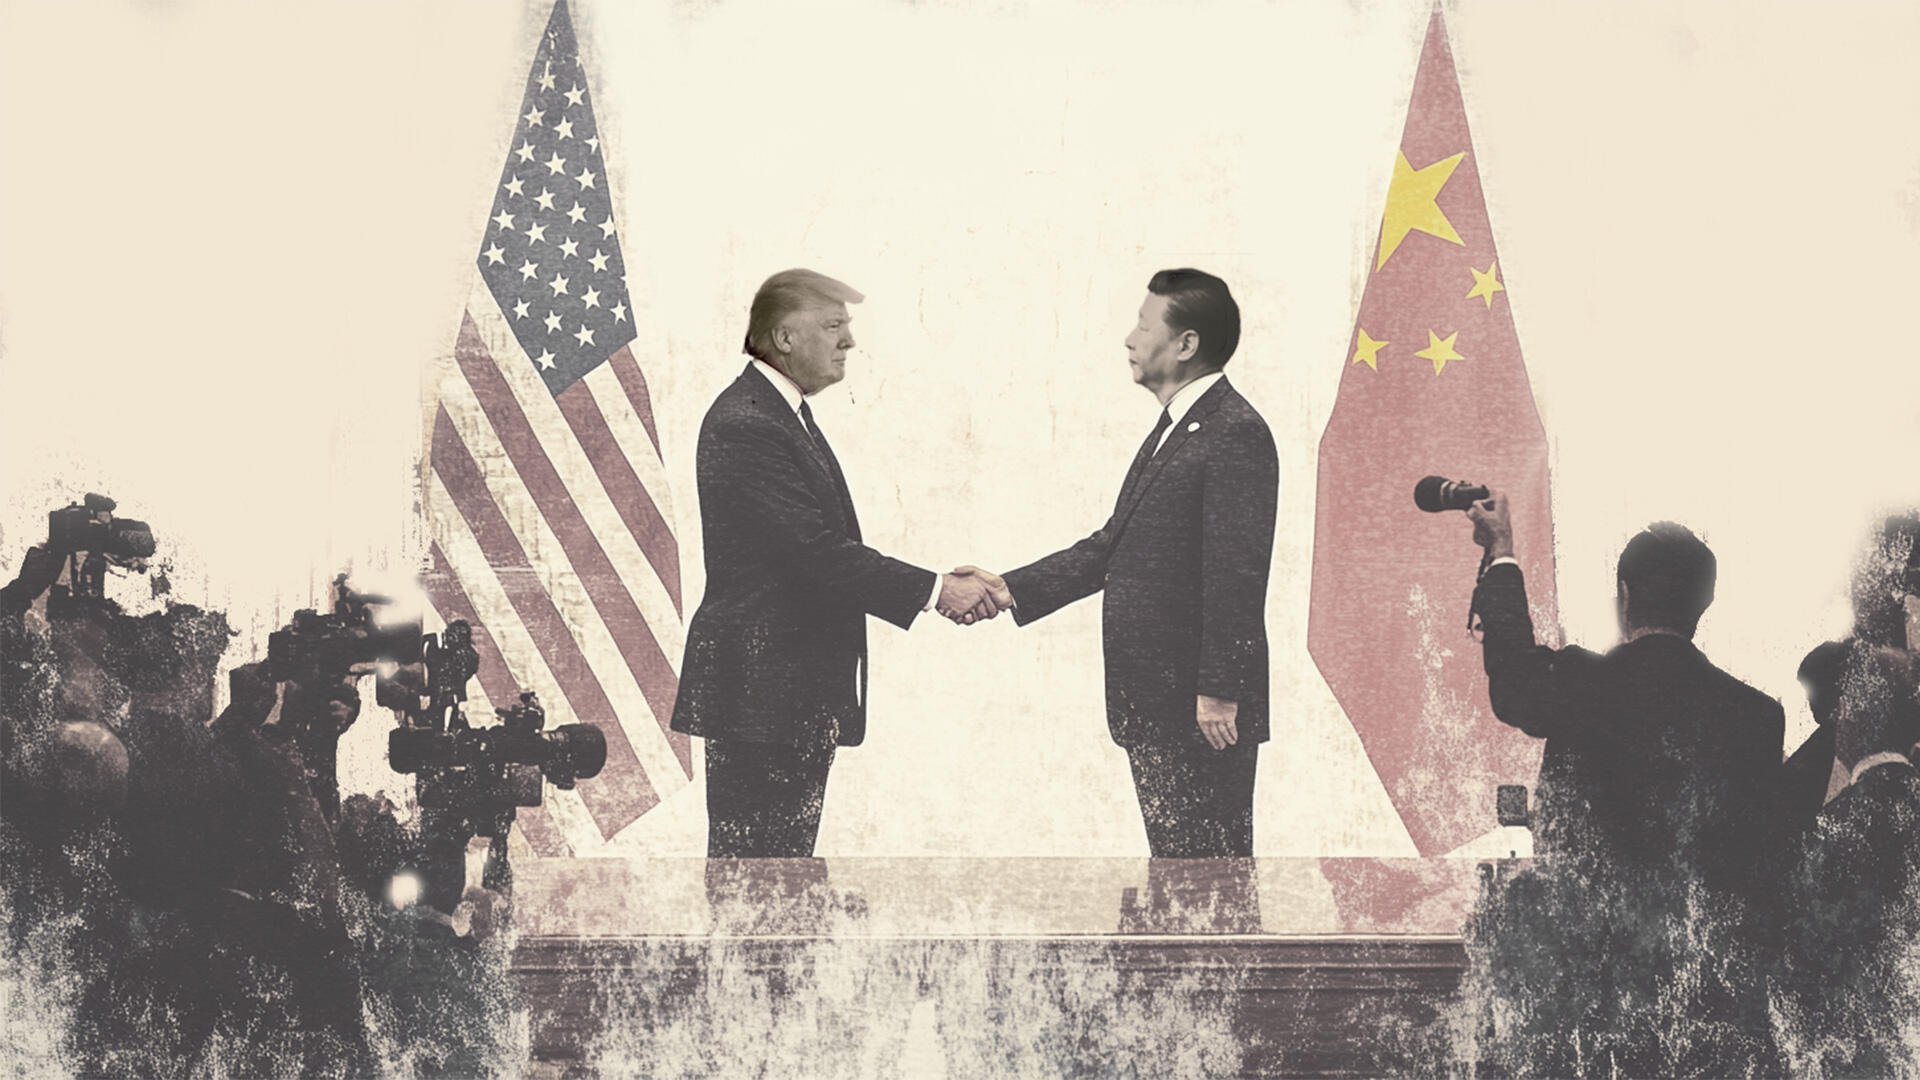
Gold Price Forecast: XAU/USD sellers refuse to give up ahead of more Trump-Xi talks
- Gold hits fresh one-week lows, testing $4,600 while on track for a weekly decline.
- The US Dollar stands tall amid rising inflation fears-led hawkish Fed expectations and higher Treasury yields.
- Gold looks to test the falling wedge resistance-turned-support, as the daily RSI flips bearish.

Gold has broken its consolidation phase to the downside in Asian trade on Friday, challenging one-week lows near $4,600 on its way to book a weekly loss.
Gold caves into US-Iran impasse, inflation risks
The optimism over an improvement in the trade relationship between the United States (US) and China, combined with increased hawkish expectations about the Federal Reserve’s (Fed) interest rate outlook, bolsters the US Dollar (USD) recovery and exacerbates the pain in Gold.
US President Donald Trump said in a Fox News interview on Friday that China will open its market in stages and intends to purchase significant volumes of US agricultural products and oil, signalling an improving geopolitical relationship with China.
Meanwhile, Trump’s comment that he is “not going to be much more patient on Iran,” fuelled a fresh bounce in Oil prices, aggravating inflation concerns and keeping the market’s narrative over the Fed’s higher for longer stance intact.
That also propelled the US Treasury bond yields higher, acting as another supportive factor for the Greenback. Gold thrives on lower interest rates and tends to lose out on the hawkish Fed expectations.
Looking ahead, it remains to be seen if Gold manages to find some relief as traders brace for day 2 of talks between Trump and Chinese President Xi Jinping.
Any discussion about ending the Iran war or further warnings on Taiwan could trigger a big reaction in Gold. The end-of-the-week flows will also influence the bright metal’s price action as the focus shifts back to the US-Iran standoff over a peace deal.
Gold price technical analysis: Daily chart
In the daily chart, XAU/USD trades at $4,609.47, extending its pullback below a dense band of moving average resistance and keeping a bearish near-term tone. Spot holds under the 21-day simple moving average (SMA) at $4,673, the 50-day SMA at $4,730 and the 100-day SMA at $4,791, suggesting rallies are being capped beneath a declining medium-term trend zone. The Relative Strength Index (14) at 43 leans lower, hinting that downside pressure persists rather than a momentum reset higher.
On the topside, initial resistance appears at the 21-day SMA near $4,673, with further hurdles at the 50-day SMA around $4,730 and the 100-day SMA close to $4,791, where sellers are likely to defend the broader downtrend. On the downside, the prior descending resistance line, now a reference support area around $4,481, precedes more solid backing at the 200-day SMA near $4,347; a daily close below this latter level would strengthen the bearish case and open the door to a deeper correction.
(The technical analysis of this story was written with the help of an AI tool.)
US-China Trade War FAQs
Generally speaking, a trade war is an economic conflict between two or more countries due to extreme protectionism on one end. It implies the creation of trade barriers, such as tariffs, which result in counter-barriers, escalating import costs, and hence the cost of living.
An economic conflict between the United States (US) and China began early in 2018, when President Donald Trump set trade barriers on China, claiming unfair commercial practices and intellectual property theft from the Asian giant. China took retaliatory action, imposing tariffs on multiple US goods, such as automobiles and soybeans. Tensions escalated until the two countries signed the US-China Phase One trade deal in January 2020. The agreement required structural reforms and other changes to China’s economic and trade regime and pretended to restore stability and trust between the two nations. However, the Coronavirus pandemic took the focus out of the conflict. Yet, it is worth mentioning that President Joe Biden, who took office after Trump, kept tariffs in place and even added some additional levies.
The return of Donald Trump to the White House as the 47th US President has sparked a fresh wave of tensions between the two countries. During the 2024 election campaign, Trump pledged to impose 60% tariffs on China once he returned to office, which he did on January 20, 2025. With Trump back, the US-China trade war is meant to resume where it was left, with tit-for-tat policies affecting the global economic landscape amid disruptions in global supply chains, resulting in a reduction in spending, particularly investment, and directly feeding into the Consumer Price Index inflation.
Author

Dhwani Mehta
FXStreet
Residing in Mumbai (India), Dhwani is a Senior Analyst and Manager of the Asian session at FXStreet. She has over 10 years of experience in analyzing and covering the global financial markets, with specialization in Forex and commodities markets.