Gold Price Forecast: XAU/USD remains poised to reclaim $2,020 in the US/ EU inflation week
- Gold price is on the driver’s seat above $2,000, consolidating its advance to six-month highs of $2,018.
- The US Dollar pauses decline amid a risk-off mood, modest uptick in US Treasury bond yields.
- Gold price closed the week above $2,000, set for more gains ahead of key inflation data.

Gold price is off the six-month high reached at $2,018 early Asia on Monday, consolidating well above the $2,000 mark amid a cautious start to a critical week ahead, dominated by the inflation data from the United States (US) and the Eurozone.
Gold price eyes $2,020 and US full market
Following the market optimism during the Thanksgiving week, risk-off flows have seeped back into Monday’s Asian trading, despite China’s push to boost financial support for private firms and improvement in Chinese Industrial Profits data.
The lack of details from the People’s Bank of China (PBOC) on its notice for more stimulus measures for private firms, combined with growing concerns over the surge in China’s respiratory illnesses temper investors’ sentiment.
A tepid risk tone is providing a floor to the US Dollar while the Greenback is also benefiting from a modest uptick in the US Treasury bond yields, capping the upside in Gold price.
Additionally, markets prefer to trade with caution, bracing for the US Federal Reserve’s (Fed) preferred inflation measure – the PCE Price Index, due for release later this week.
The US PCE inflation data will help strengthen bets for a Fed rate cut in May while the Eurozone inflation data will provide fresh insights on the European Central Bank’s (ECB) interest rate outlook. Both data will likely have a significant impact on the non-interest-bearing Gold price.
In the meantime, Gold traders will take cues from the Hamas-Israel temporary ceasefire, with mediators trying their best to extend the thaw in the Middle East conflict. The first truce since the war between Israel and Hamas started on Friday morning.
The mid-tier US New Home Sales data will offer fresh trading incentives, in the absence of high-impact economic releases and any Fedspeak.
Gold price technical analysis: Daily chart
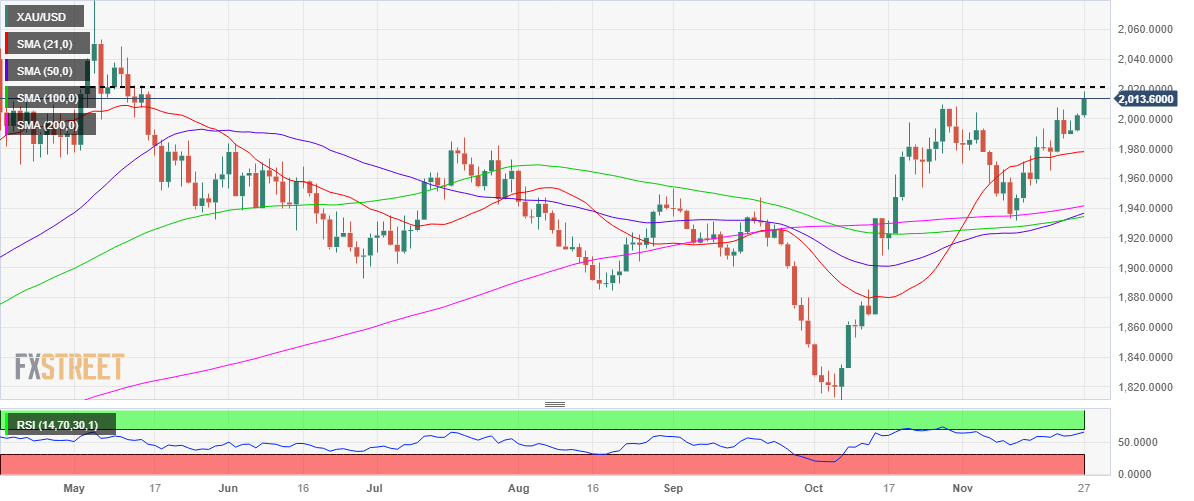
The bullish technical setup on the daily chart continues to keep the upside risks intact for Gold price, as a new week kicks in.
The 14-day Relative Strength Index (RSI) points north above the midline, approaching the overbought territory, suggesting that more gains remain in the offing.
Gold price closed Black Friday above the $2,000 threshold, strengthening the bullish bias. The immediate resistance is seen at the mid-May high near $2,020.
Acceptance above the latter will open the door for a test of the $2,050 static resistance.
On the flip side, the immediate support is seen at the $2,000 level, below which a sharp drop toward the 21-day SMA of $1,978, cannot be ruled. The next cushion is aligned in the $1,955-$1,950 region.
A sustained break below that confluence zone could threaten the November 14 low at $1,944.
Premium
You have reached your limit of 3 free articles for this month.
Start your subscription and get access to all our original articles.
Author

Dhwani Mehta
FXStreet
Residing in Mumbai (India), Dhwani is a Senior Analyst and Manager of the Asian session at FXStreet. She has over 10 years of experience in analyzing and covering the global financial markets, with specialization in Forex and commodities markets.


