- XAU/USD advanced to a fresh monthly high above $1,750.
- Next target on the upside is located at $1,762.
- Buyers are likely to remain in control unless gold makes a daily close below $1,745.
The XAU/USD pair staged a technical correction on Wednesday and posted modest losses. After managing to break above the key resistance area on Thursday, however, gold preserved its bullish momentum and reached its highest level since early March at $1,757. As of writing, the pair was up 1.05% on a daily basis at $1,756.
The sharp drop witnessed in the US Treasury bond yields seems to be fueling gold's rally on Thursday. The benchmark 10-year US Treasury bond yield, which gained 1.7% on Wednesday, turned south in the early American session and was last seen losing 2.32% at 1.637%. Consequently, the greenback is having a hard time finding demand and the US Dollar Index is trading at fresh multi-week lows near 92.10.
Earlier in the day, the data published by the US Department of Labor showed that the Initial Jobless Claims rose by 744,000 in the week ending April 3. This reading came in worse than the market expectation of 680,000 and put additional weight on the USD's shoulders.
Later in the session, St. Louis Fed President James Bullard, Minneapolis Fed President Neel Kashkari and FOMC Chairman Jerome Powell are scheduled to deliver speeches. Nevertheless, investors are likely to remain focused on the movements of the US T-bond yields and the inverse correlation between gold prices and yields is expected to remain the primary catalyst.
Gold technical outlook
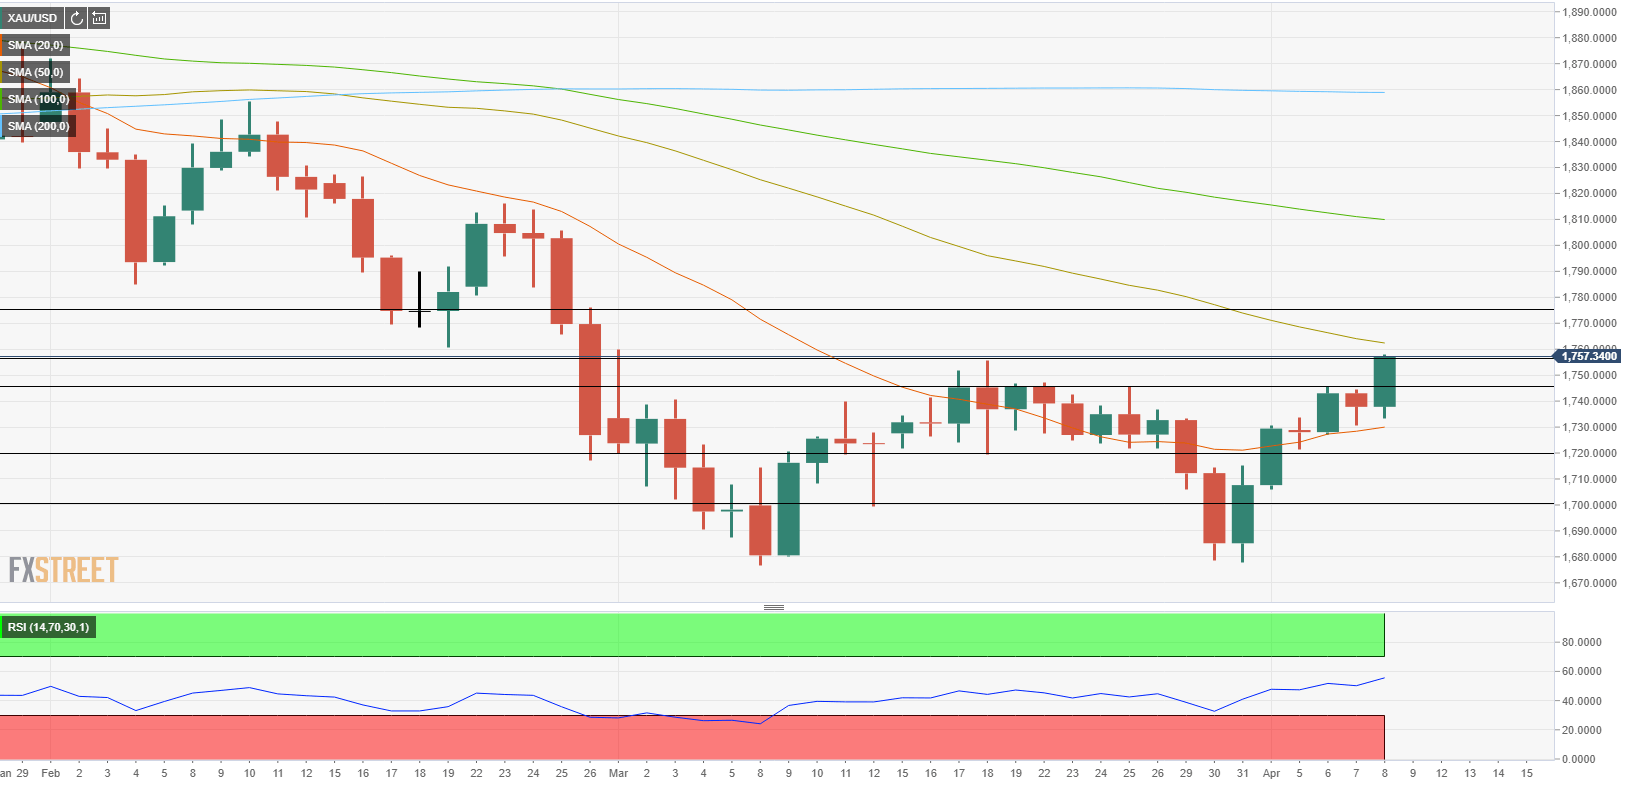
On the daily chart, the Relative Strength Index (RSI) indicator continues to edge higher and remains well below 70, suggesting that gold has more room on the upside before becoming technically overbought.
The next target could be seen at $1,762, where the 50-day SMA is located. Gold has been moving below that dynamic resistance since late January and a decisive move above that level could attract more buyers and pave the way for additional gains toward $1,775 (previous support).
On the other hand, $1,745 (previous resistance) now aligns as the first support. A daily close below that level could discourage bulls and allow for a deeper downward correction toward $1,730 (20-day SMA) ahead of $1,720 (lower limit of the latest horizontal channel).
Information on these pages contains forward-looking statements that involve risks and uncertainties. Markets and instruments profiled on this page are for informational purposes only and should not in any way come across as a recommendation to buy or sell in these assets. You should do your own thorough research before making any investment decisions. FXStreet does not in any way guarantee that this information is free from mistakes, errors, or material misstatements. It also does not guarantee that this information is of a timely nature. Investing in Open Markets involves a great deal of risk, including the loss of all or a portion of your investment, as well as emotional distress. All risks, losses and costs associated with investing, including total loss of principal, are your responsibility. The views and opinions expressed in this article are those of the authors and do not necessarily reflect the official policy or position of FXStreet nor its advertisers. The author will not be held responsible for information that is found at the end of links posted on this page.
If not otherwise explicitly mentioned in the body of the article, at the time of writing, the author has no position in any stock mentioned in this article and no business relationship with any company mentioned. The author has not received compensation for writing this article, other than from FXStreet.
FXStreet and the author do not provide personalized recommendations. The author makes no representations as to the accuracy, completeness, or suitability of this information. FXStreet and the author will not be liable for any errors, omissions or any losses, injuries or damages arising from this information and its display or use. Errors and omissions excepted.
The author and FXStreet are not registered investment advisors and nothing in this article is intended to be investment advice.
Recommended Content
Editors’ Picks
EUR/USD steady below 1.0800 after US PCE meets expectations
EUR/USD remains depressed below 1.0800 after soft French inflation data, amid minimal volatility and thin liquidity on Good Friday. The pair barely reacted to US PCE inflation data, with the Greenback shedding some pips. Fed Chair Jerome Powell set to speak ahead of the weekly close.
GBP/USD hovers around 1.2620 in dull trading
GBP/USD trades sideways above 1.2600 amid a widespread holiday restraining action across financial markets. Investors took a long weekend ahead of critical United States employment data next week. Fed Chair Powell coming up next.
Gold price sits at all-time highs above $2,230
Gold price holds near a fresh all-time high at $2,236 in thinned trading amid the Easter Holiday. Most major world markets remain closed, although the United States published core PCE inflation, the Federal Reserve’s favorite inflation gauge.
Jito price could hit $6 as JTO coils up inside this bullish pattern
Jito (JTO) price has been on an uptrend since forming a local bottom in early January. Since then, JTO has revisited the key swing point formed in early December, suggesting the bulls’ intention to move higher.
Key events in developed markets next week
Next week, the main focus will be inflation and the labour market in the Eurozone. We expect services inflation to be impacted by the easter effect, while the unemployment rate to be unchanged.