Gold Price Forecast: XAU/USD recovery appears capped near $1,850 ahead of US ISM PMI
- Gold price is extending a three-day recovery amid a pause in the US Dollar rally.
- Mixed market sentiment, hawkish ECB bets limit the US Dollar advance.
- United States ISM Manufacturing PMI could rekindle hawkish Federal Reserve expectations.
- Gold price validates a Falling Wedge formation on the 1D chart, more upside likely?

Gold price is building on its previous recovery mode, advancing for a third straight day this Wednesday while moving away from the weakest level in two months at $1,805. Investors now await the United States ISM Manufacturing PMI data for fresh trading impetus.
United States Manufacturing PMI and Federal Reserve expectations
Gold price has managed to regain the $1,830 on its road to recovery, sitting at the highest level in four trading days. The upside bias in the Gold price remains intact, as the United States Dollar (USD) has entered a consolidative mode after reaching seven-week highs.
The recent series of mixed United States economic data have led the market to reprice the hawkish US Federal Reserve (Fed) expectations, especially after the headline US Durable Goods Orders sank 4.5% in January, which sparked concerns over a potential ‘soft-landing’. The US Conference Board Consumer Confidence Index for February declined to 102.9 from 106 0 in January (revised from 107.1).
Next of relevance remains the United States official and ISM Manufacturing PMI data, which will shed more light on the strength of the US economy, impacting the Fed rate hike expectations. The headline US ISM Manufacturing PMI is seen higher at 48.0 in February vs. 47.4 previous while the Prices Paid sub-index is also likely to edge higher to 45.0. The New Orders Index will likely increase to 43.7 vs. 42.5.
Hawkish European Central Bank bets limit the US Dollar
The Gold price recovery is into being despite the hawkish European Central Bank (ECB) peak rate expectations, which keeps the EUR/USD pair underpinned, limiting the upside in the US Dollar.
Inflation rebounded in France and Spain on Tuesday and raised bets for an ECB terminal rate of 4.0% this year as against expectations of a 3.75% terminal rate seen just a week ago. Therefore, the focus will also remain on the German inflation data for the ECB repricing ahead of the Eurozone inflation data due this Thursday.
Gold price technical analysis: Daily chart
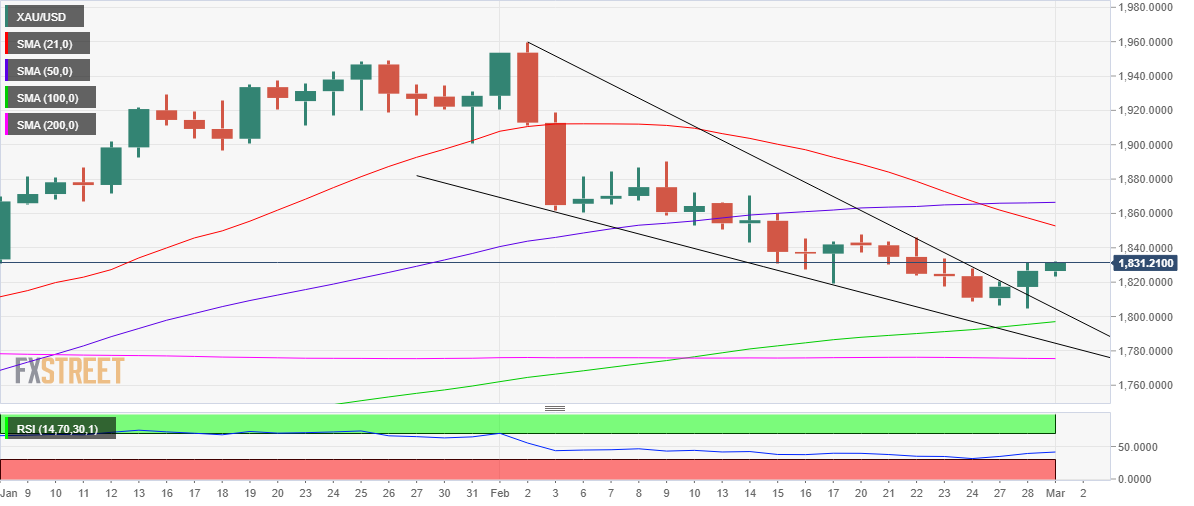
Gold price confirmed falling wedge formation on the daily chart after yielding a daily close above the falling trendline resistance at $1,813 on Tuesday.
Should the upside break find its footing, the Gold price could advance further toward the previous week’s high at $1,848, above which the $1,850 psychological level will come into play.
Further up, the downward-sloping 21-Daily Moving Average (DMA) at $1,853 could challenge the bearish commitments.
The 14-day Relative Strength Index (RSI) is rebounding toward the midline, having tested the oversold territory earlier this week.
However, Gold price could run into strong offers at higher levels, as the 21 and 50 DMAs bearish crossover could remain a drag.
Any retracement could test the initial support at the $1,820 round figure, below which the two-month low of $1,805 will be in focus.
The next downside target is seen at the $,800 threshold. The bullish 100 DMA at $1,797 will be on Gold sellers’ radars if the downside gathers momentum.
Premium
You have reached your limit of 3 free articles for this month.
Start your subscription and get access to all our original articles.
Author

Dhwani Mehta
FXStreet
Residing in Mumbai (India), Dhwani is a Senior Analyst and Manager of the Asian session at FXStreet. She has over 10 years of experience in analyzing and covering the global financial markets, with specialization in Forex and commodities markets.


