Gold Price Forecast: XAU/USD primed to test $1,794 amid a Bear Cross, ahead of United States data
- Gold price is sitting at the lowest level in two months as US Dollar holds the recent upside.
- Hawkish Federal Reserve bets, and geopolitical risks lift the US Dollar with US Treasury bond yields.
- United States Durable Goods Orders and Pending Home Sales coming up next.
- Gold price eyes $1,794 support within a potential falling wedge, as RSI stays bearish.

Gold price is consolidating just above $1,800, having hit the lowest level so far this year. Gold bears are taking a breather before the next push lower, as they await a fresh batch of United States economic data for a fresh boost.
Eyes on United States Durable Goods, Pending Home Sales
Friday’s United States Core Personal Consumption Expenditures (PCE) Price Index, the US Federal Reserve’s preferred inflation measure, to 4.7% from 4.6% in January when compared to analysts' forecast of 4.3%. The headline PCE Price Index climbed to 5.4% on a yearly basis in January from 5.3% in December. Yet another encouraging US economic release helped strengthen expectations that the Fed interest rates will remain higher for longer, with three more 25 basis points (bps) rate hikes seen in the upcoming meetings this year.
The US Dollar caught a fresh bid wave alongside the US Treasury bond yields and smashed Gold price to seven-week lows at $1,809 on Friday. Hawkish Federal Reserve expectations tend to weigh negatively on the non-yielding Gold price.
Attention now turns toward a fresh batch of United States economic data due on Monday, which includes the top-tier Durable Goods Order and Pending Home Sales data. As the Federal Reserve remains data-dependent when determining its next policy move, the state of the American economy holds the key.
Geopolitical risks: West vs. Russia and China
In the meantime, the latest developments surrounding the Russia-Ukraine war will be closely followed, especially after the United States and the European Union imposed new sanctions on Russia on the first anniversary of the so-called Russian ‘special operation’ in Ukraine.
Additionally, the United States continues to accuse China of providing lethal weapons to Russia, with the National Security Advisor Jake Sullivan citing,” China’s stance on the Russian invasion of Ukraine puts it in an “awkward” position internationally and any weapons support to Russia would come with “real costs.”
Meanwhile, China issued a peace plan on Friday, calling for a cease-fire and peace talks between Ukraine and Russia. According to CNN News, Beijing claims to have a neutral stance in the war that began one year ago but has also said it has a “no limits friendship” with Russia.
At the time of writing, Gold price is sitting close to fresh two-month lows of $1,807, reached early Monday. The US Dollar Index is finding fresh demand following a brief consolidative mode.
Escalating geopolitical tensions continue to keep investors on the lookout for safety in the US Dollar, leaving Gold price exposed to further downside risks.
Gold price technical analysis: Daily chart
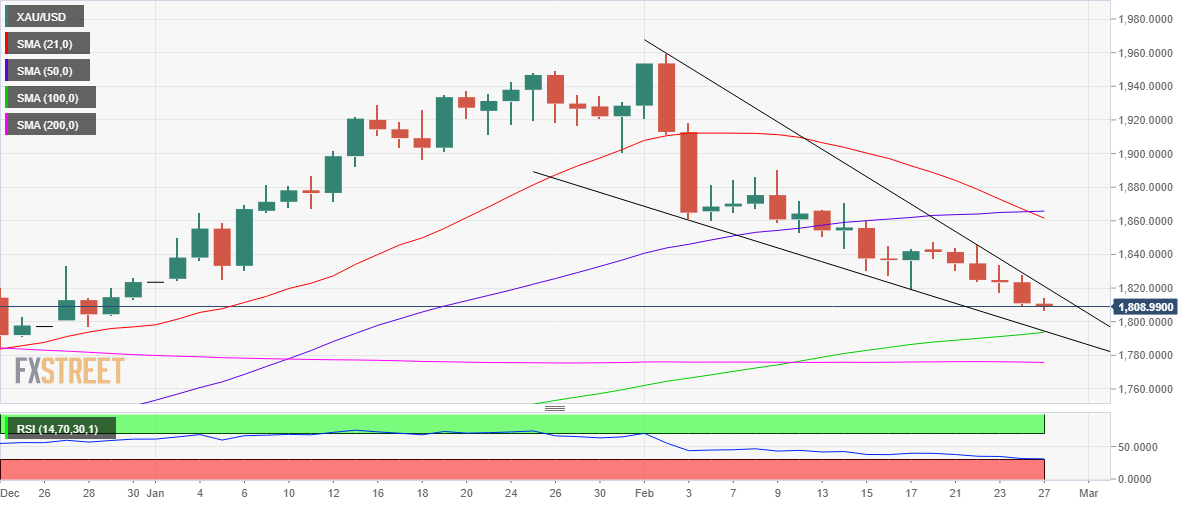
As observed on the daily chart, Gold price is maintaining its downtrend while within a falling wedge formation since peaking out at $1,960 on February 2.
Gold price is likely to test the falling trendline support at $1,794 after it has breached several crucial demand area last week. At that level, the bullish 100-Daily Moving Average (DMA) coincides.
Ahead of that level, the $1,800 level will likely offer stiff resistance to Gold sellers. The downside risks remain intact for the Gold price, as the 14-day Relative Strength Index (RSI) looks south, still above the oversold territory.
Further, confirmation of a bear cross on Friday, representated by 21 DMA having crossed the 50 DMA from above, is likely to add credence to the bearish bias in Gold price.
On the flip side, Gold price needs to yield a daily closing above the falling trendline resistance at $1,821 to attempt a meaningful recovery. In doing so, the bright metal will see amn upside break from the falling wedge.
Gold bulls will then target the $1,830 round figure and Thursday’s high at $1,834 on the road to recovery.
Premium
You have reached your limit of 3 free articles for this month.
Start your subscription and get access to all our original articles.
Author

Dhwani Mehta
FXStreet
Residing in Mumbai (India), Dhwani is a Senior Analyst and Manager of the Asian session at FXStreet. She has over 10 years of experience in analyzing and covering the global financial markets, with specialization in Forex and commodities markets.


