Gold Price Forecast: XAU/USD falls toward $1,890 ahead of US ISM Manufacturing PMI
- Gold price stalls rebound from three-month lows of $1,893 early Monday.
- US Dollar sees fresh demand with US Treasury bond yields.
- Focus remains on $1,890 for Gold sellers, with a Bear Cross in play and a bearish RSI.

Gold price has paused the late-recovery seen last week just above $1,920, starting out a new week on the wrong foot this Monday. A renewed upswing in the United States Dollar (USD) alongside the US Treasury bond yields weighs on Gold price.
United States ISM Manufacturing PMI eyed amid light trading
The US Dollar is recovering ground against its main currency peers, following a second weekly decline even though markets continued pricing roughly 85% chance of a 25 basis points (bps) rate hike by the Fed in July. Friday’s US stocks rally, the end-of-the-quarter flows and soft United States inflation data exacerbated the pain in the US Dollar, and US Treasury bond yields also pulled back sharply from three-month highs. Gold price went further away from multi-month troughs near $1,895.
US stock market rally was fuelled by the optimism surrounding Apple Inc. share price after the launch of its Vision Pro, which made Apple the first publicly traded company to end a trading day above $3 trillion in its fourth straight record closing.
Meanwhile, cooler-than-expected US inflation in May also offered some comfort to US equities. The annual Core Personal Consumption Expenditures (PCE) Price Index, the Federal Reserve's preferred gauge of inflation, edged lower to 4.6% in May from 4.7% a month earluer. The headline PCE Price Index fell to 3.8% on a yearly basis in May from 4.3% in April, compared with expectations of 4.6%. Softer US inflation data raised doubts over the Fed’s rate hike path after the expected July 25 bps rate increase, boosting sentiment around the non-yielding Gold price.
In the day ahead, the focus will be on the United States ISM Manufacturing PMI Index and its sub-components for reinforcing the encouraging views on the economy, as investors reprice Fed expectations for this year. However, trading conditions are expected to remain thin as desks in the US could be deserted ahead of the July 4 Independence Day holiday.
Gold price technical analysis: Daily chart
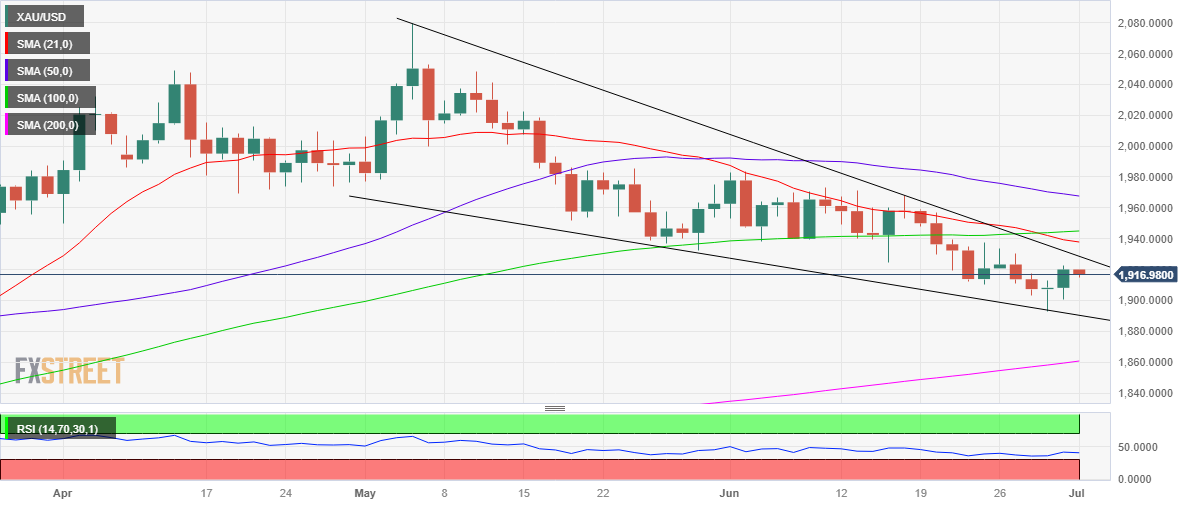
Technically, Gold price remains exposed to downside risks in the immediate term, as the bright metal confirmed a Bear Cross on Thursday after the downward-sloping 21-Daily Moving Average (DMA) cut the mildly bullish 100-DMA from above.
The 14-day Relative Strength Index (RSI) also continues to lurk below the midline, justifying the bearish technical outlook on Gold price.
On the downside, immediate support awaits at the $1,900 threshold, below which the three-month low of $1,893 will be retested. The next target on Gold sellers’ radars is seen at the descending trendline at $1,890.
Note that Gold price has been traversing within a falling wedge after topping out at record highs of $2,080 in early April.
That said, Gold price will need to crack the falling trendline resistance at $1,929 on a daily closing basis to validate an upside break from the falling wedge formation.
The next critical resistance is seen at the descending 21-DMA at $1,938, which will be a tough nut to crack for Gold buyers.
Premium
You have reached your limit of 3 free articles for this month.
Start your subscription and get access to all our original articles.
Author

Dhwani Mehta
FXStreet
Residing in Mumbai (India), Dhwani is a Senior Analyst and Manager of the Asian session at FXStreet. She has over 10 years of experience in analyzing and covering the global financial markets, with specialization in Forex and commodities markets.


