Gold Price Forecast: XAU/USD has room to fall after hawkish Fed minutes, $1,795 holds the key
- Gold remains vulnerable amid Covid woes, Fed’s aggressive tightening bets.
- US ISM Services PMI eyed while Fed sentiment will lead the way.
- Gold’s 4-hour technical setup points to a decline towards the key $1,795 support.

Gold price saw good two-way businesses on Wednesday, as traders enjoyed a roughly $20 intra-day movement amid a return of volatility and full markets. The yellow metal rallied hard and almost tested $1,830 in the first half of the day, as the US dollar tumbled, in anticipation of the FOMC minutes and amid Omicron optimism. The greenback failed to take advantage of a strong US ADP print, which saw the American private sector adding 807K jobs in December vs. 400K expectations. On the release of the hawkish FOMC minutes, the tide turned in favor of gold bears, as the metal witnessed a sharp retracement towards the $1,800 mark.
The December Fed meeting’s minutes showed that the officials discussed faster tightening to contain the inflationary risks while also beginning its balance sheet reduction. The dollar rebounded in tandem with the Treasury yields, as expectations ramped up on aggressive tightening by the world’s most powerful central bank. The benchmark 10-year US rates recaptured the 1.70% level, hitting the highest level since April 2021. Gold price, however, found some temporary respite from the post-Fed minutes tech sell-off on Wall Street, as it settled the day at $1,810.
Gold price is extending the previous slump towards $1,800 on Thursday, with bears reigning in ahead of the US Services PMI release. The US dollar and yields hold firmer amid broad risk-aversion, triggered by concerns over coronavirus contagion and the Fed’s hawkishness. The Fed sentiment will lead the way and keep the downside exposed for gold price. If the risk aversion deepens, it will further strengthen the dollar’s recovery even though the rally in the yields falter. In any scenario, gold is likely to remain on a losing end, with every upside to be seen as a good selling opportunity ahead of Friday’s US Nonfarm Payrolls release.
Gold Price Chart - Technical outlook
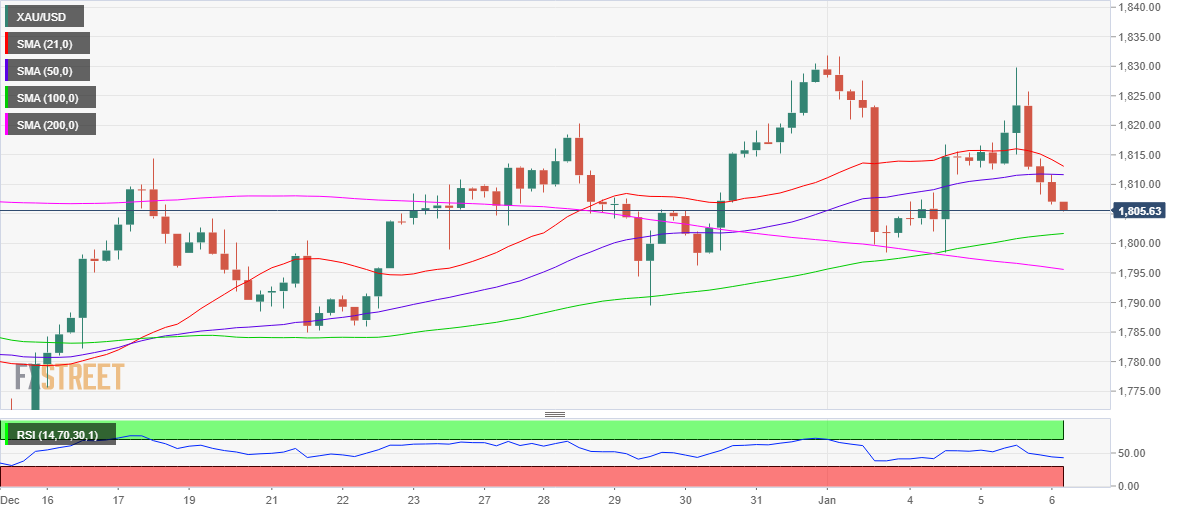
Gold: Four-hour chart
Gold’s 4-hour chart paints a bearish picture in the near term. Having breached the 50-Simple Moving Average (SMA) at $1,812 in the overnight trades, gold bears are now targeting the upward-sloping 100-SMA at $1,802.
The descent in the Relative Strength Index (RSI) below the central line is adding credence to the potential downbeat view on the bright metal.
A failure to resist the 100-SMA cap will expose the bearish 200-DMA support at $1,795. Sellers will then aim for the December 29 low of $1,789 on persistent downward pressure.
On the flip side, strong resistance appears around $1,812, the confluence of the 50 and 21-SMAs.
Any recovery attempt could gain traction if the latter is taken out on a four-hourly candlestick closing basis.
The next stop for gold bulls is envisioned at the $1,820 round figure, above which Wednesday’s high could be retested.
Premium
You have reached your limit of 3 free articles for this month.
Start your subscription and get access to all our original articles.
Author

Dhwani Mehta
FXStreet
Residing in Mumbai (India), Dhwani is a Senior Analyst and Manager of the Asian session at FXStreet. She has over 10 years of experience in analyzing and covering the global financial markets, with specialization in Forex and commodities markets.


