Share:

XAU/USD Current price: $1,990.15

  • Mixed United States data weighed on the market mood.
  • Market players await clues about US debt ceiling talks.
  • XAU/USD plunged below $2,000 and points to extend its slide.

Spot Gold is down on Tuesday, piercing the $2,000 threshold during the American afternoon. Market players resumed buying the US Dollar after Wall Street’s opening and following a string of United States (US) data.

US Retail Sales increased in April, although by less than anticipated. The figure reflected some strength in consumer spending categories, printing a modest 0.4% monthly advance and reverting previous losses. Additionally, April Capacity Utilization increased by 79.7%, as expected, while Industrial Production in the same month rose 0.5%, better than anticipated. Finally, the NAHB Housing Market Index printed at 50 in May, improving from the previous 45.

The data dampened the mood, with US indexes trading in the red after a positive start to the day. European indexes changed direction before the close and finished the session with modest losses. Meanwhile, government bond yields jumped. The 10-year Treasury note currently yields 3.56%, up 5 basis points (bps), while the 2-year note offers 4.10% raising 10 bps on the day.

Further weighing on sentiment, market players await clues from debt-ceiling negotiations. President Joe Biden and lawmakers will meet in a few hours to try to reach an arrangement to extend it and avoid a default.

XAU/USD price short-term technical outlook

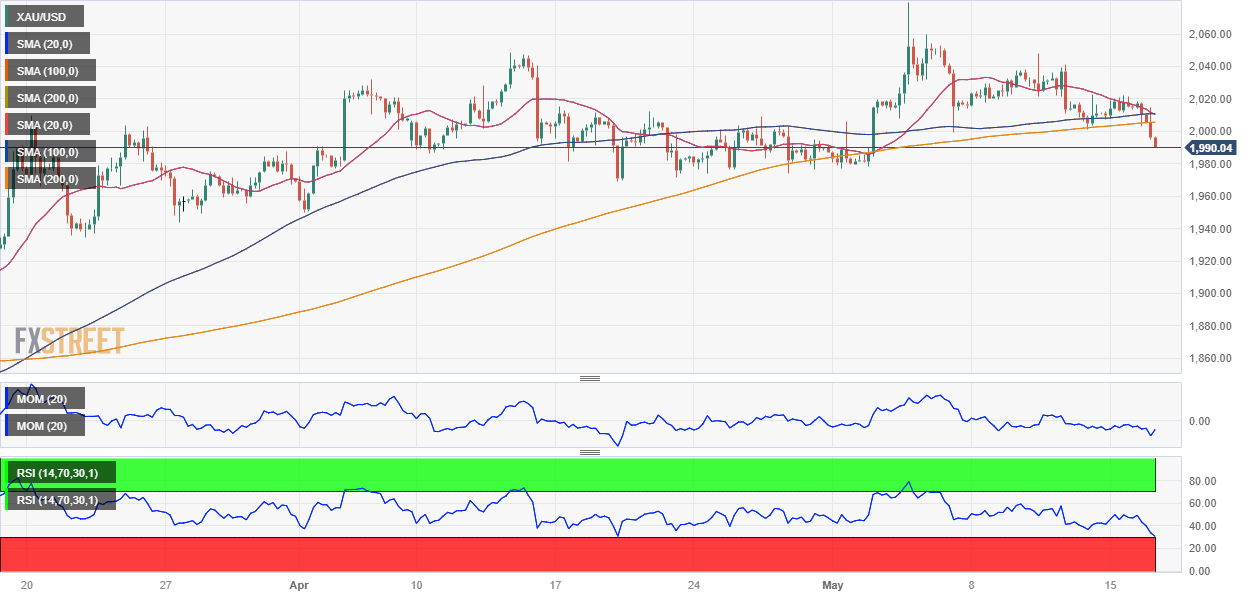
XAU/USD accelerated its slide once below the $2,000 level and currently trades in the $1,991 region, at its lowest in two weeks. The daily chart shows that the bright metal sunk below a directionless 20 Simple Moving Average (SMA), while the longer ones maintain their bullish slopes far below it. At the same time, technical indicators turned lower and are currently piercing their midlines, anticipating additional declines in the upcoming sessions.

The near-term picture is bearish. The 4-hour chart shows that the pair develops well below all its moving averages, with the 20 SMA gaining downward traction above the longer ones. Meanwhile, technical indicators head firmly south within negative levels, with the Relative Strength Index (RSI) indicator entering oversold territory without signs of bearish exhaustion.

Support levels:  1,987.45 1,969.20 1,956.70

Resistance levels: 1,989,75 2,008.40 2,029.10  

View Live Chart for XAU/USD   

Share: Feed news

Information on these pages contains forward-looking statements that involve risks and uncertainties. Markets and instruments profiled on this page are for informational purposes only and should not in any way come across as a recommendation to buy or sell in these assets. You should do your own thorough research before making any investment decisions. FXStreet does not in any way guarantee that this information is free from mistakes, errors, or material misstatements. It also does not guarantee that this information is of a timely nature. Investing in Open Markets involves a great deal of risk, including the loss of all or a portion of your investment, as well as emotional distress. All risks, losses and costs associated with investing, including total loss of principal, are your responsibility. The views and opinions expressed in this article are those of the authors and do not necessarily reflect the official policy or position of FXStreet nor its advertisers. The author will not be held responsible for information that is found at the end of links posted on this page.

If not otherwise explicitly mentioned in the body of the article, at the time of writing, the author has no position in any stock mentioned in this article and no business relationship with any company mentioned. The author has not received compensation for writing this article, other than from FXStreet.

FXStreet and the author do not provide personalized recommendations. The author makes no representations as to the accuracy, completeness, or suitability of this information. FXStreet and the author will not be liable for any errors, omissions or any losses, injuries or damages arising from this information and its display or use. Errors and omissions excepted.

The author and FXStreet are not registered investment advisors and nothing in this article is intended to be investment advice.

Follow us on Telegram

Stay updated of all the news

Join Telegram

Recommended Content


Follow us on Telegram

Stay updated of all the news

Join Telegram

Recommended Content

Editors’ Picks

EUR/USD loses traction, retreats below 1.0600

EUR/USD loses traction, retreats below 1.0600

EUR/USD lost its recovery momentum and declined below 1.0600 in the American session on Friday, erasing a portion of its daily gains in the process. Nevertheless, the risk-positive market atmosphere after PCE inflation data helps the pair limit its losses.

EUR/USD News

GBP/USD turns negative on the day below 1.2200

GBP/USD turns negative on the day below 1.2200

GBP/USD reversed its direction and slumped below 1.2200 in the American session on Friday after rising above 1.2270 earlier in the day. Position readjustments and profit-taking on the last trading day of the quarter seems to be weighing on Pound Sterling.

GBP/USD News

Gold reverses direction, drops below $1,860

Gold reverses direction, drops below $1,860

Following a steady rebound toward $1,880 on Friday, Gold price made a sharp U-turn and turned negative on the day near $1,860. Although the 10-year US T-bond yield is down more than 1%, XAU/USD struggles to find demand on the last day of Q3.

Gold News

Polkadot Price Forecast: DOT reversal seems inevitable after 92% correction from all-time high

Polkadot Price Forecast: DOT reversal seems inevitable after 92% correction from all-time high

Polkadot price, in nearly two years, has shed 92.91% from its all-time high of $55.09. The massive downswing in DOT has pushed it down to levels that were last seen in October 2020. Hence, the chances of this altcoin forming a bottom and rallying are high. 

Read more

Earnings beat triggers Nike to spike 9%

Earnings beat triggers Nike to spike 9%

Nike (NKE) stock has surged over 9% in Friday’s premarket, climbing above $98 per share, following late Thursday’s fiscal first-quarter earnings release. Nike beat pessimistic earnings expectations by more than 23% and hiked its dividend by 9%.

Read more

Majors

Cryptocurrencies

Signatures