Gold Price Forecast: XAU/USD eyeing a sustained move above $1750 ahead of Powell
- Gold in bullish consolidation just below $1750 ahead of Powell’s speech.
- DXY drops with Treasury yields amid solid bond auction and upbeat US CPI.
- The 4H chart suggests that XAU/USD is primed for a falling wedge breakout.

Gold (XAU/USD) staged an impressive bounce from six-day lows of $1724 on Tuesday, helped by a sharp sell-off in the dollar that ensued after an uptick in the US Consumer Price Index (CPI) data for March. The inflation report failed to re-ignite inflation fears and boost Fed tapering expectations, weighing negatively on the greenback alongside the Treasury yields. Further, solid demand for a 30-year bond auction deepened the sell-off in the US rates, exacerbating the pain in the buck. However, the rebound in gold remained capped by another record close on Wall Street indices.
So far this Wednesday’s trading, gold is consolidating the recent recovery rally below $1750, awaiting Fed Chair Jerome Powell’s speech, due later in the day, for fresh trading impetus. With upbeat US PPI and CPI data, the expectations of higher inflation will continue to support the inflation hedge, gold. Meanwhile, a pause in the use of Johnson & Johnson's COVID-19 vaccine weighs on the market mood, keeping gold afloat.
Gold Price Chart - Technical outlook
Gold: Four-hour chart
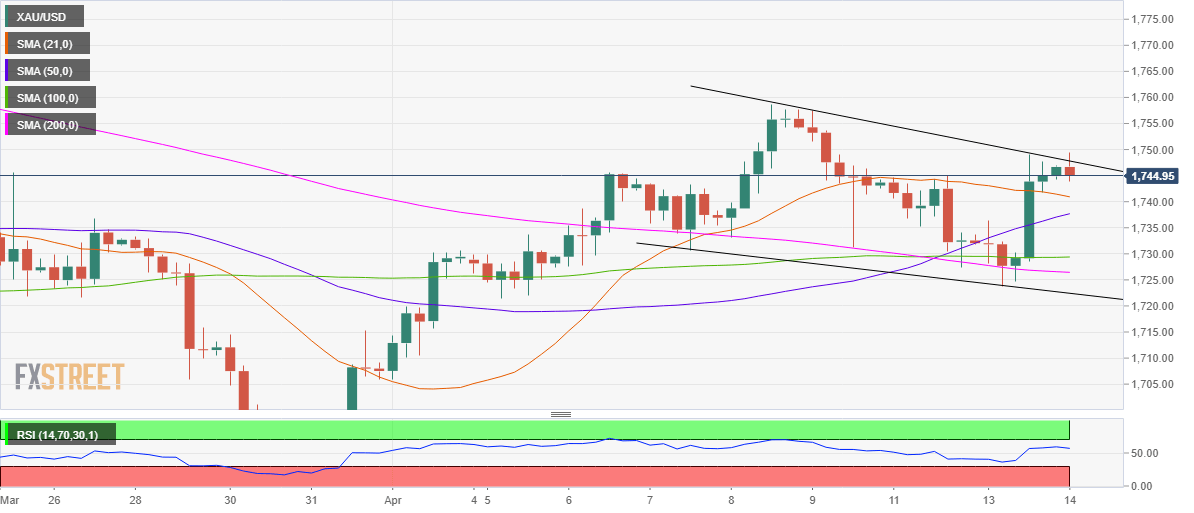
Gold’s four-hour chart shows that the price is on the verge of the breakout out of a falling wedge breakout, with a four-hour candlestick closing above the falling trendline resistance at $1748 eyed to confirmed the bullish continuation pattern.
The next stop for the XAU bulls is seen at the $1750 psychological level, beyond which the April 8 high at $1759 could be tested.
The Relative Strength Index (RSI) has turned flat but holds well above the midline, suggesting that the bulls are likely to remain in control.
Any pullback will see the downward-sloping 21-simple moving average (SMA) at $1741 guarding the downside.
Acceptance below the latter could expose the bullish 50-HMA support at $1738.
Thursday’s U-turn occurred after Gold bulls faced rejection below the 100-SMA at $1745.
The Relative Strength Index (RSI) has turned flat while holding above the midline, suggesting that the XAU buyers still remain hopeful.
To the upside, Thursday’s high at $1739 could be probed again, above which the 100-SMA remains on the buyers’ radars. The next stop for the bulls is seen at $1760, the March 1 high.
Further south, strong support is seen around the $1730-$1727 zone, which is the confluence of the 100 and 200-HMAs.
Premium
You have reached your limit of 3 free articles for this month.
Start your subscription and get access to all our original articles.
Author

Dhwani Mehta
FXStreet
Residing in Mumbai (India), Dhwani is a Senior Analyst and Manager of the Asian session at FXStreet. She has over 10 years of experience in analyzing and covering the global financial markets, with specialization in Forex and commodities markets.


