Gold Price Forecast: XAU/USD down but not out ahead of US PMI data
- Gold price corrects from near all-time highs early Friday, anticipating US PMI data.
- US Dollar attempts a comeback amid cautious mood, despite sluggish US Treasury bond yields
- Gold price remains exposed to upside risks, as the daily technical setup indicates.

Gold price is on a corrective move lower from near record highs of $2,955 set on Thursday. Despite the pullback, Gold price remains on track to book the eighth consecutive weekly gain.
Gold price eyes eighth weekly rise and US PMI data
The latest leg down in Gold price could be attributed to profit-taking as traders reposition ahead of the first critical economic data release from the United States (US) this week – the S&P Global Preliminary business PMIs.
The data could help markets refocus on the US Federal Reserve’s (Fed) outlook on interest rate cuts after the Minutes of the January policy meeting failed to alter their expectations of two rate reductions this year.
The Minutes backed the Fed cautious stance on Wednesday as it showed that “many participants noted that the committee could hold the policy rate at a restrictive level if the economy remained strong and inflation remained elevated” in the face of Trump’s trade policies.
Persistent expectations that the Fed will likely deliver two rate cuts in 2025 continue to underpin the sentiment around the non-yielding Gold price.
That said, any adverse reaction to the strong PMI data on Gold price could be short-lived if fresh developments surrounding US President Donald Trump’s tariff plans hit the wires and strengthen the safe-haven demand for the traditional store of value – Gold.
The recent tariff talks by Trump and geopolitical tensions around Russia-Ukraine peace deal have supported the record rally in Gold price.
However, the bright metal could extend its correction from lifetime highs if traders cash in on their longs ahead of next week’s US Personal Consumption Expenditures (PCE) inflation data release.
All in all, any dip in Gold price will likely be seen as a good buying opportunity in the near term.
Gold price technical analysis: Daily chart
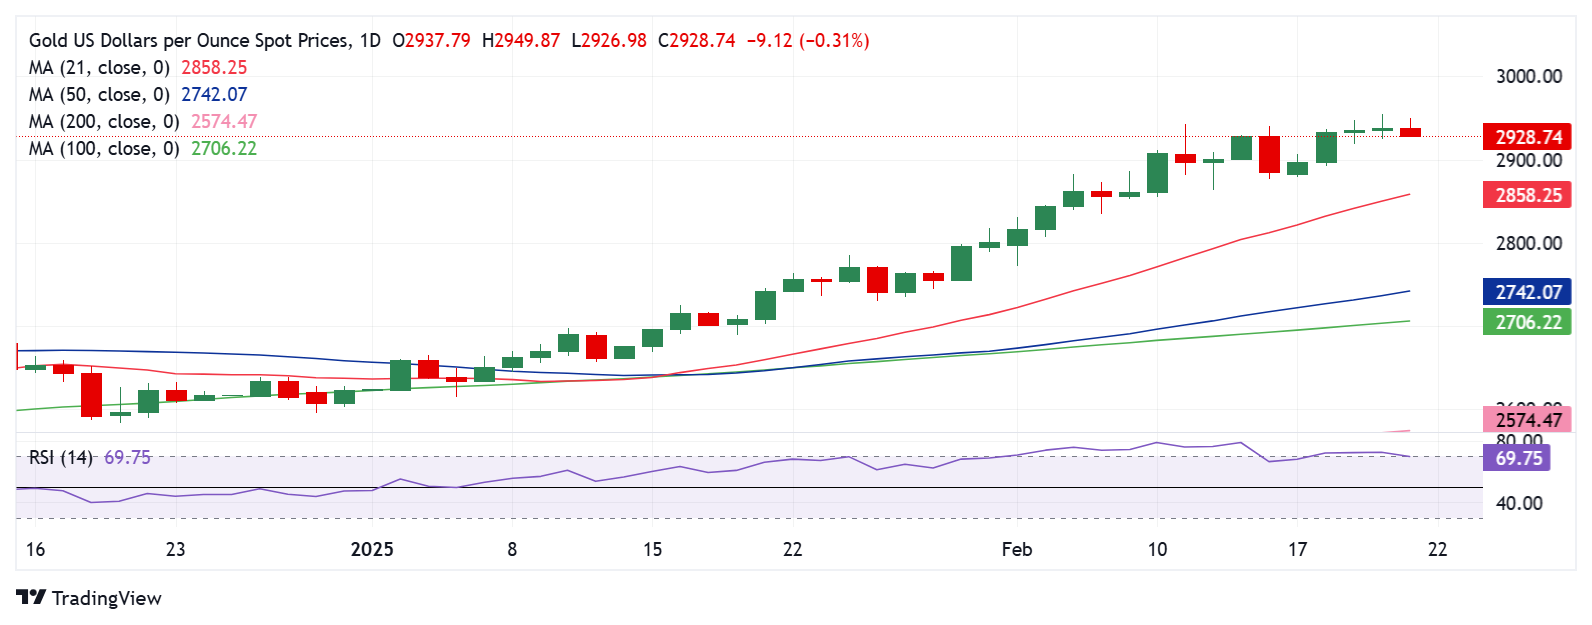
Gold price turns lower after failing to find acceptance above the $2,950 psychological mark on a daily candlestick closing basis.
But the 14-day Relative Strength Index (RSI) returns to the bullish zone, currently near 69.75, suggesting a ‘buy-the-dips’ trade in the Gold price.
A sustained break above the $2,950 barrier could resume the record rally. The next relevant resistances are seen at $2,970 and the $3,000 key figure.
Conversely, a fresh pullback could call for a test of the $2,900 round level, below which the February 14 low of $2,877 will be threatened.
A firm break of that level will initiate a fresh downside toward the $2,850 psychological barrier.
Economic Indicator
S&P Global Manufacturing PMI
The S&P Global Manufacturing Purchasing Managers Index (PMI), released on a monthly basis, is a leading indicator gauging business activity in the US manufacturing sector. The data is derived from surveys of senior executives at private-sector companies from the manufacturing sector. Survey responses reflect the change, if any, in the current month compared to the previous month and can anticipate changing trends in official data series such as Gross Domestic Product (GDP), industrial production, employment and inflation. A reading above 50 indicates that the manufacturing economy is generally expanding, a bullish sign for the US Dollar (USD). Meanwhile, a reading below 50 signals that activity in the manufacturing sector is generally declining, which is seen as bearish for USD.
Read more.Next release: Fri Feb 21, 2025 14:45 (Prel)
Frequency: Monthly
Consensus: 51.5
Previous: 51.2
Source: S&P Global
Author

Dhwani Mehta
FXStreet
Residing in Mumbai (India), Dhwani is a Senior Analyst and Manager of the Asian session at FXStreet. She has over 10 years of experience in analyzing and covering the global financial markets, with specialization in Forex and commodities markets.


